 A drawdown is a contraction in the value of a portfolio. There are several types of equity drawdowns including a maximum drawdown and a period drawdown. To identify a maximum trading drawdown, you must first see a recovery in the value of your portfolio back to the previous peak, which will allow you to measure the equity drawdown your portfolio experienced.
The definition of drawdown can vary, as there are several nuances including using a specific time horizon to measure a drawdown such as a quarterly or annual basis. Additionally, some forex traders measure forex trading drawdowns based on their maximum equity in their portfolio, or via a specific strategy. While it is important to evaluate the drawdown during a specific period, it is paramount to know what the historical maximum drawdown of your portfolio is.
Maximum Drawdown Explained
The Maximum drawdown reflects the maximum equity loss you have experienced in your portfolio. This measure can be very important to you when you are analyzing your own portfolio or evaluating other traders to determine if you want to place your funds with them.
The maximum drawdown is a measure of the largest drop from the peak of your equity to the trough of your equity over the history of the portfolio. You can only measure the maximum drawdown once a new peak is generated. The maximum drawdown formula is:
Equity Peak High – Equity Trough Low) / Equity Peak High
Here is a maximum drawdown calculation example. Let’s say you begin your portfolio with $5,000, and it increases in value to $10,000, and then subsequently declines to $4,000, and then increases to $12,000, then decreases to $3,000, then increases to $13,000. In this case, the max drawdown is ($12,000-$3,000)/$12,000 = 75%.
Note that the highest peak of your portfolio is $13,000 which is not included in the maximum drawdown calculation. Additionally, the decline from $10,000 to $4,000 has no effect on how to calculate max drawdown because $10,000 was not the highest peak. There are several online drawdown calculators that can assist in determining your maximum drawdown.
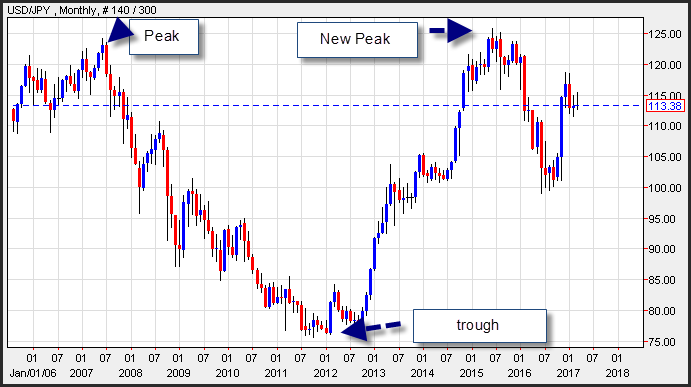
In the example below you will see the USD/JPY monthly chart. You could theoretically calculate the maximum drawdown on this forex pair, once the currency pair hits a fresh new peak in 2015. The peak to trough calculation would calculate the percent loss that you would experience if you purchased the currency pair when the exchange rate hit its 2007 high with the currency pair trough when it hit its 2012 lows.
The maximum drawdown usually refers to the largest drawdown since inception. You can also calculate the maximum drawdown per a period, but many times this is just referred to as the monthly or quarterly drawdown.
There are several ways to measure a period drawdown. You could measure the value of your portfolio at the beginning of every three-month period and compare that to the value of your portfolio 90-days later. You could have a rolling analysis where periods could start every day during the life of the fund or at the beginning of every month.
In this situation, you are looking for the worst drawdown during this rolling period which would be called a maximum period drawdown. Some traders will even consider a maximum drawdown over a specific period since inception. You could also measure the peak to trough drawdown during a month or quarter, which would be your maximum drawdown for a period.
Average Drawdown During a Period
When you are evaluating drawdowns during specific periods such as monthly or quarterly, you can use the average drawdown. You can then compare the maximum drawdown to the average drawdown to determine if the maximum drawdown was a one-off event or an experience that should be normally expected from your trading strategy. You can also look at the standard deviations of your drawdowns to determine if this is the case.
For example, if your average quarterly drawdown over a 10-year period is 5%, and your maximum drawdown is 30%, and the standard deviation of the returns is 4%, then you can assume that over the 40 quarters that you have run this portfolio, that the 30% is a one-off situation. The reason for this is with an average drawdown of 5%, and a standard deviation of 4% (which means that 2-standard deviations is approximately 8% – which incorporates 95% of all the data), most of the drawdowns should be within 13% (5% plus 2-standard deviations = 13%). The 30% is an outlier well beyond the 2-standard deviation range of 13%.
The maximum draw down encapsulates what is considered tail risk which is the risk associated with an event that is unlikely to occur. A portfolio that boasts smooth gains of 1% per month over a 5-year period that has a maximum drawdown of 30% should produce a red flag. On the other hand, a fund that is generally volatile and produces a large maximum drawdown tends to reflect the tail risk of this volatility.
The maximum drawdown is not a perfect measure of risk as it is time dependent. The longer a track record of an investment manager the more likely that maximum drawdown will be significant. Drawdown frequency, as well as the size of the drawdown also needs to be considered. Additionally, a maximum drawdown is a backward looking event, but it can give you an idea of the manager’s appetite for risk.
A maximum drawdown should be measured against market conditions to determine if the tail risk was caused by high beta or inappropriate risks.
For example, during the financial crisis a few portfolio managers experienced significant drawdowns which was a function of risk and the beta of the market. A large drawdown during calm less volatile periods could be a function of excessive leverage.
The beta describes the volatility of a security and its relationship to a broader measure of risk. The beta can describe systematic risk of a portfolio in comparison to the market. So, if your portfolio has a beta of one relative to the dollar index, then it will be 100% correlated to the returns of the dollar basket. Beta helps calculate the expected return of a portfolio relative to the expected overall market returns.
Maximum Drawdown Duration
Another data point that is used to evaluate the historical performance of a portfolio is the length of the maximum drawdown. The maximum drawdown duration is the longest time between peaks. This could coincide with the largest peak to trough loss, but might not always be the case. You might have a flash crash that generated a maximum drawdown that lasts only a few weeks, which might be larger than the longest period where you experience a drawdown.
While many investors are concerned with the maximum drawdown of a portfolio, there is much less attention paid to the maximum drawdown duration. Many investors believe that the duration of a drawdown is more painful that the magnitude. While nobody wants to experience a potential 20% loss over a few months, it can be less stressful than the same 20% drawdown that lasts multiple years.
Many traders place a lot of importance on the maximum drawdown figure. Even if your objectives are to produce returns with a long-term bias, the short-term performance volatility matters, especially when there are adverse market conditions. This issue is most pertinent when you compare the portfolio you are evaluating to a broader index. When you are trading currencies, you can use an index such as the dollar index as a base for comparison.
The maximum drawdown is a handy way of measuring the worst expected scenario of portfolio performance. One of the benefits of using maximum drawdown is that it does not incorporate additional data points such as the standard deviation or semi-deviation or downside deviation.
Calmar Ratio
A useful risk measurement metric that incorporates maximum drawdown is the Calmar ratio. The ratio is calculated by dividing the annualized growth rate of a portfolio by the maximum drawdown during the same period. To compare two portfolios using the Calmar ratio, you need to compare them over the same period.
Asymmetrical Leverage
A drawdown in your portfolio represents a significant risk to investors and recovering from a sharp loss can be difficult. Experienced traders know that the amount required to recoup a loss will increase dramatically and disproportionately as the loss increases. This is typically referred to as Asymmetrical Leverage. For example, a 25% decline in the value of your portfolio requires a 33% increase to recover your losses. A 50% decline in your account would require a 100% increase to recover the loss. There is a saying that many traders take to heart which is “live to trade another day”. By managing your downside risk, you can better survive the adverse effects to your trading account.
What Kinds of Drawdown Should You Expect?
The drawdown in your portfolio will typically be correlated to the level of risk exposure of your trading strategy. If your strategy is systematic, you can base future drawdowns on historical maximum drawdowns. If you are a relative value trader, who is looking for a currency pair to rebound after a substantial dip, then you should have an idea of how far you would let your trade move against you before you cut your position. Using historical data to determine theoretical past drawdowns is a great way to gauge maximum drawdowns or drawdowns over a certain period. But always remember, that your worst drawdown is yet to come.
The reward that you experience is predicated on the risk you take. If you are using a trend following trading strategy such as a moving average crossover, you should expect that the strategy will lose more than it wins, and, that you will experience prolonged drawdown, until the market begins to enter a trending phase.
When you design your trading strategy you need to be cognizant of the types of drawdown you expect to occur, and be willing to accept this drawdown as part of your trading business.
Creating a Drawdown Plan
Unfortunately, drawdowns are part of forex trading. Potential reward is inextricably linked to risk, meaning Investors will typically generate returns which are predicated on the level of risk they are willing to assume.
The key to managing a drawdown is to have a risk management plan that allows you to survive adverse market conditions. By creating a drawdown plan, you can determine how you will handle your risk if the market moves against you during an unexpected Black Swan type event or during a prolonged losing streak.
You can start this process by determining the maximum loss you are willing to assume before you terminate the trading strategy. Your risk should be a function of the reward you are attempting to generate. For example, if you are looking to double your portfolio within a year, you might need to accept a risk where you may lose nearly half your portfolio. Many newbie traders have a hard time understanding this concept and as a result they tend to blow up their accounts using excessive leverage.
You should also consider managing your drawdowns on a monthly basis, as well as, on an annualized basis. Many trading plans have monthly cut offs, as well as, an annualized maximum drawdown. For example, if your maximum drawdown for termination is 30%, you might consider a monthly maximum drawdown of 5-6 %.
What’s the Plan if You Reach Your Drawdown Limit?
A natural question you might have is what are you expected to do if you hit your monthly drawdown. There are several techniques you can perform to mitigate your risk if you hit your monthly stop loss level. For example, you could completely unwind your risk and flatten your positions. You could also hedge your exposure with options which allows you to reduce your exposure but remain in your positions.
For example, if you are long EURUSD, you might consider the purchase of a Euro FX put option that expires at the end of the month. While the premium might take you above the maximum drawdown for the period, you will have reduced any additional losses, but can participate in the upside if EURUSD moves in your favor. Recall, a put option is the right but not the obligation to sell a security at a specific price on or before a certain date.
One of the benefits of trading the forex market is that most of the currency pairs are liquid and as a trader you can exit a position with little slippage at any point in time. While some currency pairs are more liquid during specific time zones, the majors and crosses always provide some form of liquidity.
If you have a position in an illiquid exotic currency pair, such as an emerging market currency pair, that is difficult to sell, then you might need to consider what type of proxy you can utilize if your losses exceed your maximum drawdown.
Part of your drawdown plan might be to trade a basket of currencies or products that are uncorrelated where you might experience a maximum loss in one security, but the other securities in your portfolio offset those losses.
Prior to trading, you should have an idea of how you will handle your drawdowns. You should think about how you will handle your risk in specific situations. Most importantly, if you are trading illiquid assets, determine if you can absorb an outsized loss, if the market moves abruptly in a manner adverse to your position.
Trading Pitfalls
One trading pitfall that novice traders typically engage in, is trading multiple related currency pairs using the same trading strategy. These can lead to returns that are highly correlated to one another, and while the gains can be exceptional, when the market turns against you, all your positions can lose money at the same time. This is a scenario you want to avoid.
One way to avoid this is to run a correlation analysis on the currency pairs you want to trade in your portfolio to see if they are highly correlated. If the correlation between the currency pairs are consistently above 80%, you should avoid using these currency pairs to trade the same strategy at the same time.
Summary
You need to understand that drawdowns are a natural part of trading. You should expect that your portfolio will have drawdowns that are consistent with your trading strategy and risk management. The maximum drawdown is a very important statistic that describes the peak to valley loss percentage associated with your trading strategy.
Since drawdowns are part of your trading business it is important to create a plan that will handle drawdowns as they occur. You should determine exactly what assets should be liquidated or hedged if the securities in your portfolio experience losses that are beyond the tolerance set for an individual period such as a month, quarter or year.
You should avoid trading highly correlation currency pairs or assets using the same trading strategy as your potential drawdown can be larger than you expect if the performance of your securities decline all at the same time.
By sticking to a drawdown plan, you are more likely to manage and weather drawdowns and live to trade another day.