If you are a fan of trading with naked charts, without the use of crowded indicators that can cloud your judgement, then this material will definitely appeal to you. In this article, we are going to talk about trading price action using candlestick analysis. I will go through some of the most important candlestick patterns and will explain to you their potential.
What are the Japanese Candlesticks?
Japanese candlesticks is a visual form for displaying charts invented in the 18th century by a Japanese rice trader named Munehisa Homma. They differ from bar charts and line charts, because they give more information and can be more easily read. Let’s take a look at the image below:
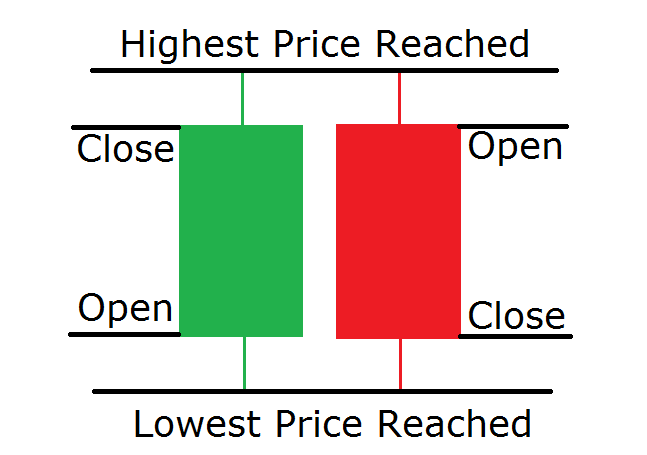
This simple sketch points out all the information a Japanese candlestick will give you. The two candles displayed are a bullish (green) and a bearish (red) candle. Each candle shows the price at which the candle (the time frame) was opened, the price at which the candle was closed, the highest and the lowest price reached. Note that the bearish candles (red) move downwards, so “close” and “open” places are switched. Now look how Japanese candlesticks looks on a price chart.
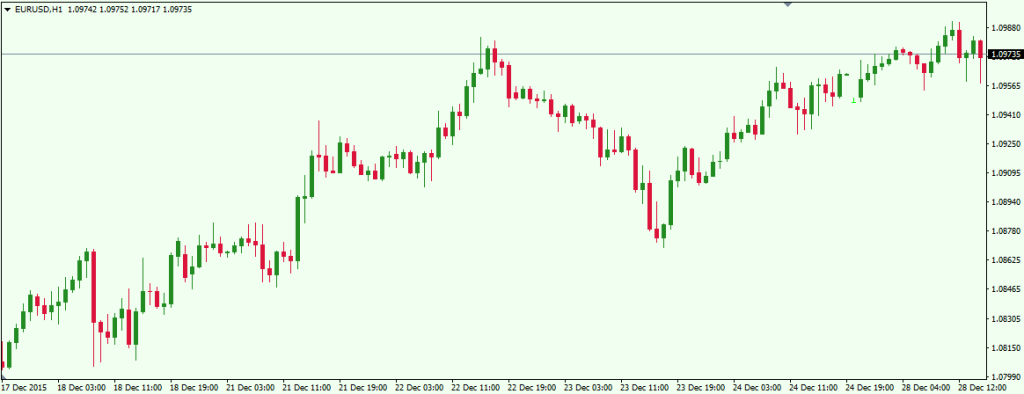
Much better than the bar or line chart, don’t you think?
How to use Japanese candlesticks?
A Japanese candlestick chart provides the trader with crucial information about price action at any given point in time. Traders often confirm their signals with Japanese candlestick patterns, improving the odds of success on a trade.
Trading price action using candlestick analysis alone is a very common trading technique. Yet, candlestick trading tends to be the most powerful when confirmed with additional indicators or when combined with Support and Resistance zones.
Candlestick patterns in Forex are specific on-chart candle formations, which often lead to certain events. If recognized on time and traded properly, they can assist in providing high probability setups.
Forex candlestick patterns are classified within two types – candlestick continuation patterns and candlestick reversal patterns. We will now go through the most common reversal and continuation patterns and we will discuss their potential.
Single Candlestick Patterns
-
Doji (reversal / indecision)
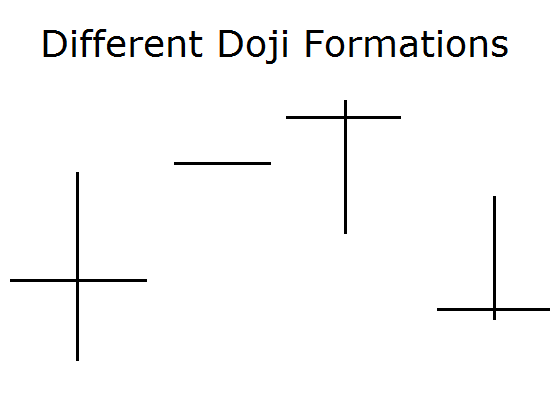
Doji is a very easy to recognize candlestick. We have a Doji whenever the price closes at the exact same level where it has opened. Thus, the Doji candle looks like a dash with a wick.
Note that sometimes there are cases when the price doesn’t move at all from the opening. In these cases the Doji candle is simply a dash with no wicks. Take a look at this image:
The Doji candle has a reversal character when it is formed after a prolonged move. The reason for this is that during a bullish (or bearish) market, the occurrence of a Doji candle indicates that the bulls are losing powers and the bears start acting with the same force.
Thus, the candle closes wherever it was opened. Just remember: when you get a Doji on the chart after a prolonged move, there is a chance that the price will reverse its direction.
-
Spinning Tops (undefined)
This candle could be bearish and bullish. It has a very small body and longer upper and lower candle wick, which have approximately the same size. Have a look at the image below:
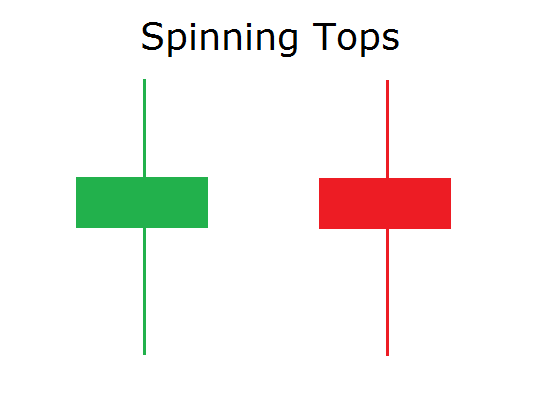
The Spinning Tops have undefined character.
The reason for this is that this candle indicates that buyers and sellers are fighting hard against each other, but none of them could gain dominance.
Nevertheless, if we get this candle on the chart during a downtrend, this means that the sellers are losing steam, even though buyers cannot prevail.
-
Marubozu (continuation)
This is another easy to recognize candle. The Marubozu candlestick has a body and no candle wick as shown below:
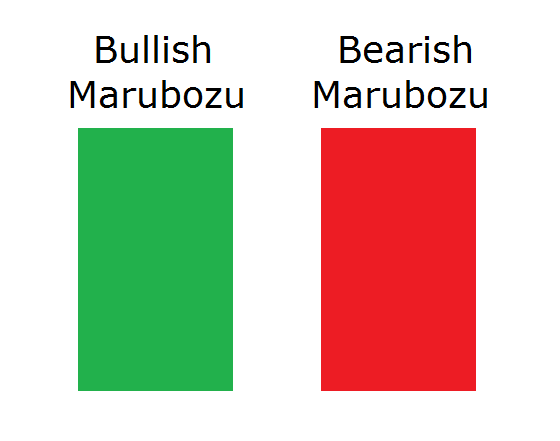
The Marubozu candle is a trend continuation pattern. Since it has no wicks, this means that if the candle is bullish, the uptrend is so strong that the price in the candle is increasing and never reaches below the opening of the bar
-
Hammer and Hanging Man (reversal)
The Hammer candle and the Hanging Man candle have small bodies, small upper wick and long lower wick. These two candles look absolutely the same. Here they are:
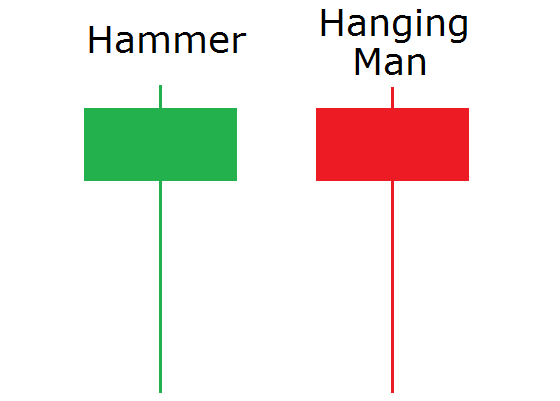
These two candles are classified as reversal patterns. The difference between them, though, is that the hammer indicates the reversal of a bearish trend, while the hanging man points to the reversal of a bullish trend.
-
Inverted Hammer and Shooting Star (reversal)
The Inverted Hammer and the Shooting Star are the mirror images of the Hammer and the Hanging Man. They have small bodies, small lower candle wick and long upper wick as shown below:
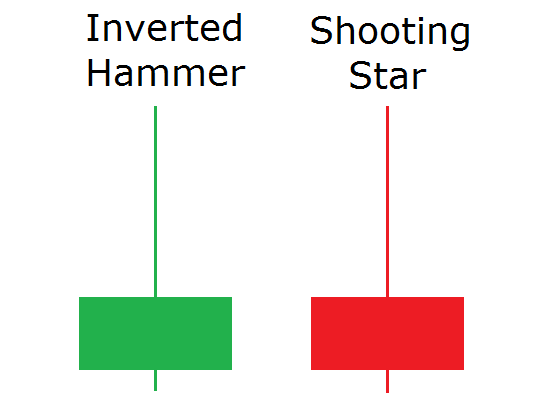
The Inverted Hammer and the Shooting Star both exhibit reversal behavior, where the Inverted Hammer refers to the reversal of a bearish trend, while the Shooting Star indicates the end of a bullish tendency.
Double Candlestick Patterns
-
Bullish and Bearish Engulfing (reversal)
The Bullish Engulfing is a double bar candlestick formation, where after a bearish candle we get a bigger bullish candle. Respectively, the Bearish Engulfing consists of a bullish candle, followed by a bigger bearish candle. Have a look at this image:
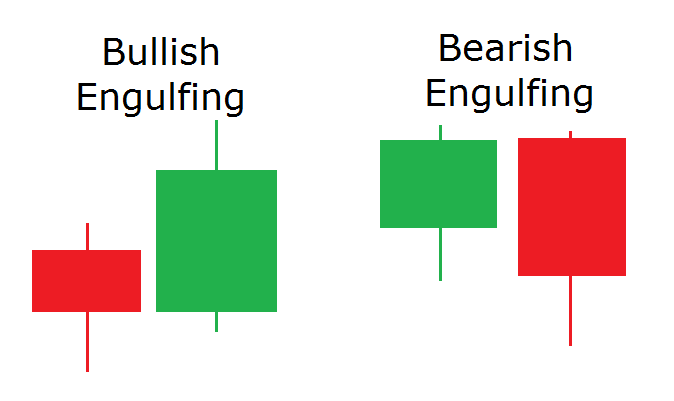
The two Engulfing candle patterns indicate trend reversal. In both the Bullish and Bearish Engulfing pattern formation the second candle engulfs the body of the first. The Bullish Engulfing indicates the reversal of a bearish trend and the Bearish Engulfing points the reversal of a bullish trend.
-
Tweezer Tops and Bottoms (reversal)
The Tweezer Tops consist of a bullish candle, followed by a bearish candle, where both candles have small bodies and no lower candle wick. The two candles have approximately the same parameters.
At the same time, the Tweezer Bottoms consist of a bearish candle, followed by a bullish candle. Both candles have small bodies and no upper candle wick as shown in the image below:
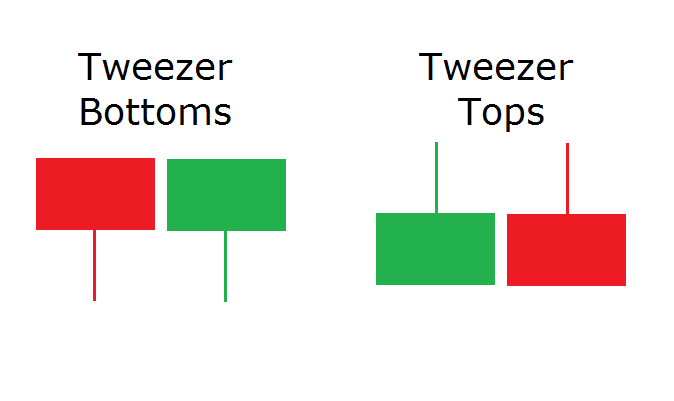
As we said, the two candles of the Tweezers have approximately the same size. Both candlestick patterns have reversal character. The difference between these two formations is that the Tweezer Tops signal a potential reversal of a bullish trend into a bearish, while the Tweezer Bottoms act the opposite way – they could be found at the end of a bearish trend, warning of a bullish reversal.
Triple Candlestick Patterns
-
Morning Star and Evening Star (reversal)
The Morning Star candlestick pattern consists of a bearish candle followed by a small bearish or bullish candle, followed by a bullish candle which is larger than half of the first candle.
The Evening Star candle pattern is the opposite of the Morning Star pattern. It starts with a bullish candle, followed by a tiny bearish or bullish candle, followed by a bearish candle which is bigger than half of the first candle. The image below will illustrate the two formations:
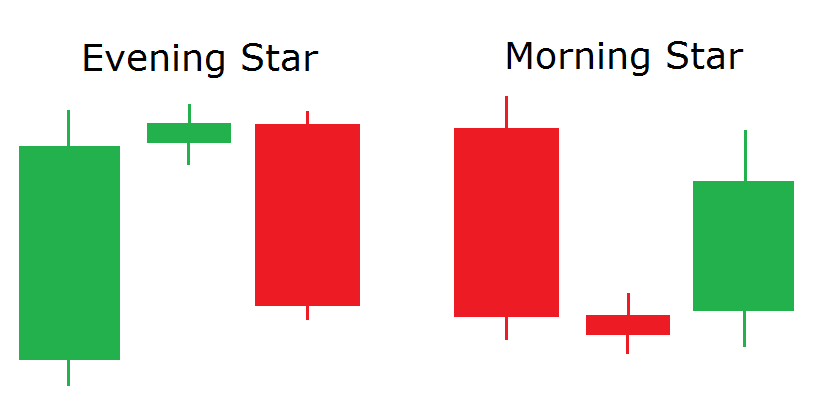
Both of these candlestick groups have reversal character, where the Evening Star indicates the end of a bullish trend and the Moring Star points to the end of a bearish trend.
-
Three Soldiers (reversal)
The Three Soldiers candlestick pattern could be bearish or bullish. The Three Bullish Soldiers consists of three bullish candles in a row:
- A smaller bullish candle
- A bigger bullish candle, which closes near its highest point
- An even bigger bullish candle, which has almost no candle wick
At the same time, the confirmed Three Bearish Soldiers should have the following characteristics:
- A smaller bearish candle
- A bigger bearish candle, which closes near its lowest point
- An even bigger bearish candle, which has almost no candle wick
The image below displays a valid Three Bullish Soldiers and Three Bearish Soldiers:

The Three Soldiers candlestick pattern has a reversal character.
The Three Bullish Soldiers candlestick pattern can end a bearish trends and can bring about a new bullish movement. At the same time the Three Bearish Soldiers could be found at the end of bullish tendencies, signaling an upcoming bearish move.
Candlestick Chart Analysis
Now that we have gone through some of the more reliable candlestick patterns in Forex trading, we can now see how some of these patterns look on a price chart and how we can use them as part of a price action trading strategy! Have a look at the chart below:
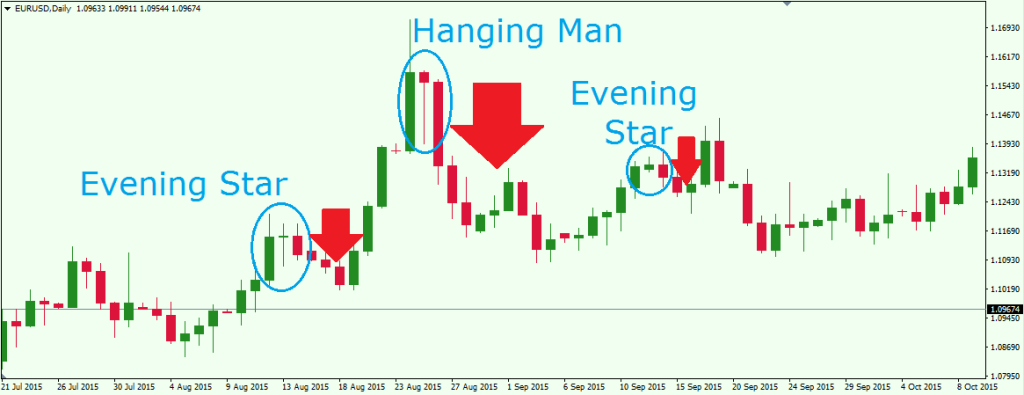
This is the daily chart of the EUR/USD for the period Jul 21 – Oct 8, 2015. Our candlestick chart analysis shows three successful bearish chart patterns. The first one is an evening star. As we already mentioned, the Evening Star candlestick chart pattern has a bearish character. This is exactly what happens on our chart. We get four bearish candles which corresponds to a drop in price of 126 pips. The second pattern we get from our candlestick analysis is the Hanging Man candle at the end of a bullish trend. After the appearance of the Hanging Man candle, the price of the euro decreased versus the dollar about 387 pips for three days! The third candlestick pattern on our chart is another Evening Star. At the end of the bullish trend, the Evening Star pattern followed thru with a drop of 40 pips for one day.
Let’s now go through another chart example illustrating other Japanese candlestick patterns:
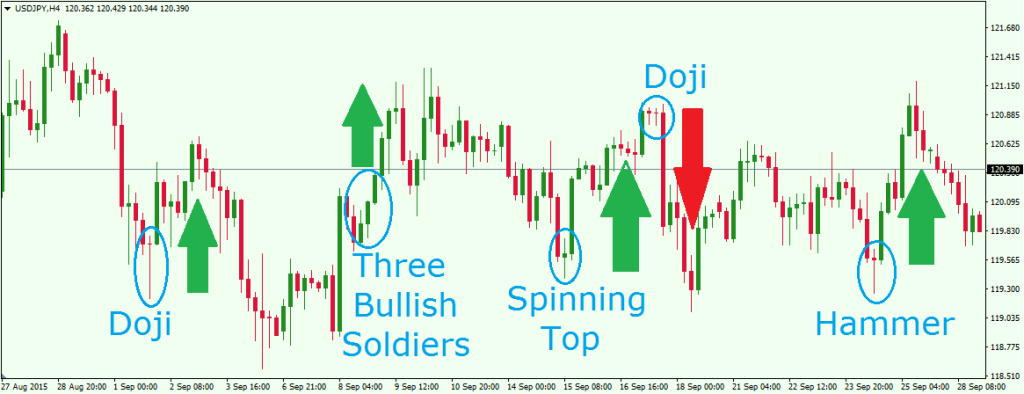
This is the 4-hour chart of the USD/JPY for the period Aug 28 – Sep 28, 2015. As you see, this chart image is pretty rich with Japanese candlestick patterns. We first start with a Doji candle after a strong price decrease. We get the Doji reversal pattern and we record an increase of 97 Pips. The next candlestick pattern we get is the Three Bullish Soldiers, which appears after a slight price retracement. After the Three Soldiers reversal pattern the USD price increases about 86 pips versus the Yen.
The third candle pattern on the chart is the Spinning Top, which as we said has undefined character. This means that after a Spinning Top candle, the price might either increase or decrease, depending on the context of price action at the time. In our case, the price reverses its direction on the following bar, which also forms a Morning Star pattern, and we observe an increase of 138 pips. The price increase after the Spinning Top is immediately followed by another Doji reversal pattern. As a result of that, we get a rapid drop of 182 pips. The last candlestick pattern on the chart is a single Hammer candlestick after a bearish trend. We confirm our Hammer and the price of the dollar increases about 163 pips.
Let’s now go to the USD/CHF, where we will mainly discuss the bullish and bearish Engulfing Pattern:
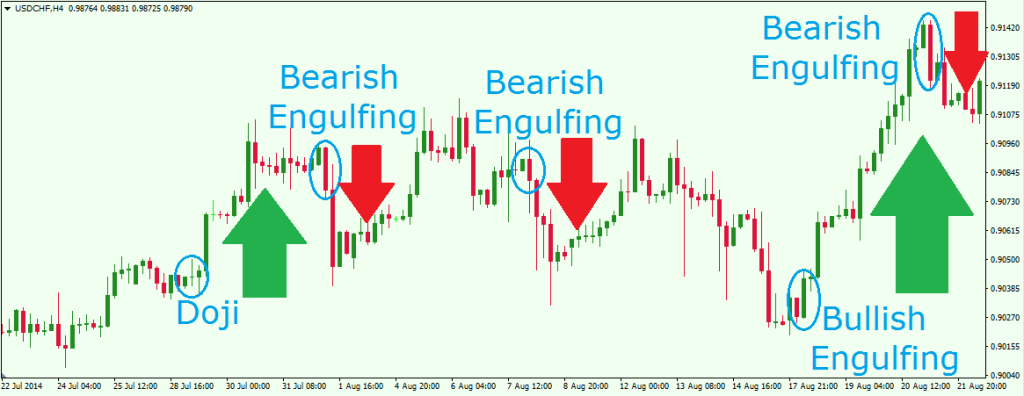
So, above we have the 4-hour chart of the USD/CHF for Jul 22 – Aug 21, 2014. We start with a small Doji candle after a trend correction. The result we get after the Doji is a rapid price increase of 62 pips. Then after a period of price consolidation, we get a Bearish Engulfing. A single candle drop of 39 pips appears on the chart right after the Engulfing! Not long after, we get another Bearish Engulfing, which comes after a correction in a bearish trend. The price of the USD decreases with 50 pips for about 12 hours after this Bearish Engulfing. 10 days later, we spot a Bullish Engulfing on the chart, which comes after a bearish trend. This is the most profitable price move on this chart, which leads to an increase of 100 pips for three days. This bullish trend finishes with the last chart pattern on the image – a third Bearish Engulfing. This again results in a price reaction to the downside. The overall result from these five price movements is equal to 264 pips.
Let’s analyze another Forex chart using candlestick patterns!
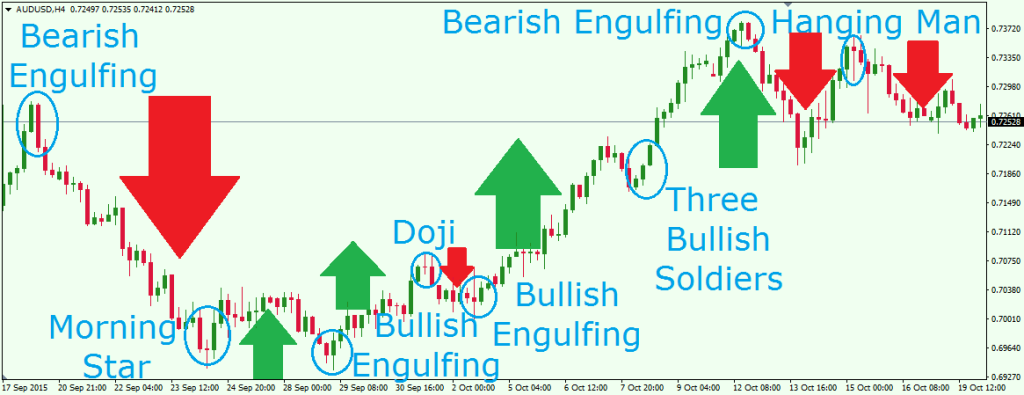
This is the 4-hour chart of the Aussie (AUD/USD) for the period Sep 17 – Oct 19, 2015. We start with a Bearish Engulfing after a price increase. We confirm the pattern and we observe a steady price decrease equal to 284 pips for 6 days. Now that’s a strong reaction! The bearish trend ends with a morning star, which points to an eventual reversal. The reversal of the trend follows in more of a consolidation phase. The increase in price from the morning star is equal to 46 pips. The price decreases to the same level and we get another reversal pattern – a Bullish Engulfing! A strong bullish trend emerges after the Bullish Engulfing pattern. We could have traded the first increase of 110 pips until we get a Doji reversal candle, which resulted in a 66 pip correction.
Soon afterward we see another Bullish Engulfing formation. The price records dramatic increases on strong momentum. Furthermore, after a short corrective movement, the bullish trend gets confirmed by the Three Bullish Soldiers candle pattern, which is another confirmation that the bulls definitely dominate! We stay in the market until we get the Bearish Engulfing at the end of the trend. The overall price increase equals 384 pips. After the Bearish Engulfing we get a decrease of 160 pips. Then, after a new increase, we get the Hanging Man candlestick pattern, which is followed by a new price decrease of 80 pips. The total price action in this example equals about 1,000 pips for 1 month, More than enough opportunity to make high probability trade setups using candlestick patterns.
As you can see, trading Forex with Japanese candlestick patterns could be very profitable. Japanese candlesticks are the preferred way to display Forex charts, because of the depth of information it provides. Although we discussed 13 successful candlestick pattern trades, there can be many fake signals that show up as well. Therefore, it is always good to match your candlestick pattern signal with an additional trading tool.
This could be a moving average, a volume indicator, a momentum oscillator or Support and Resistance levels based on previous swings. Fibonacci Retracement levels are another good trading tool to confirm candlestick patterns. Try to use uncorrelated technical confluence when trading candlestick signals in order to eliminate as many false signals as possible. When adding an additional layer of confirmation to your candlestick trading strategy, you might even increase your candle pattern success rate to more than 60-65 %.
Conclusion:
- Japanese candles are the preferred way to display Forex charts.
- A Japanese candle gives the following information:
- Open Price (body)
- Highest Price (upper wick)
- Lowest Price (lower wick)
- Close Price (body)
- Japanese candlestick patterns are an essential part of every price action trader’s arsenal.
- Japanese candlestick patterns are:
- Trend continuation candlestick patterns
- Trend reversal candlestick patterns – the most common candle patterns
- The most popular and reliable candlestick patterns include:
- Single Candlestick Patterns – Doji, Marubozu, Spinning Tops, Hammer, Hanging Man, Shooting Star, Inverted Hammer
- Double Candlestick Patterns – Bullish and Bearish Engulfing, Tweezer Tops and Bottoms
- Triple Candlestick Patterns – Morning Star, Evening Star, Three Bullish Soldiers, Three Bearish Soldiers
- The most popular and reliable candlestick patterns include:
- Signals from Japanese candlestick patterns should to be confirmed using other technical studies in order to trade only the highest probability setups. Some of these tools are:
- Support Resistance Lines
- Momentum Oscillators
- Moving Averages
- Volume Indicators
- Fibonacci Levels