In this article, we will take a look at how to trade the EURUSD pair. This pair is the most liquid currency pair in forex and consists of the two most important currencies worldwide – the U.S Dollar and the Euro. We will go through various tips and best practices for trading EURUSD. We will discuss the best time of day to trade this pair, which fundamental factors move this currency pair, a common technical strategy, and how news effects its overall price movement.
EURUSD Currency Overview
The US dollar is the most traded and largest reserve currency in the world. It is used by other nations officially or unofficially as their adopted currency.
The amount of US dollars in circulation is controlled by the Federal Reserve Bank (Fed), and the actions it takes occurs during the scheduled Federal Open Market Committee (FOMC) meetings.
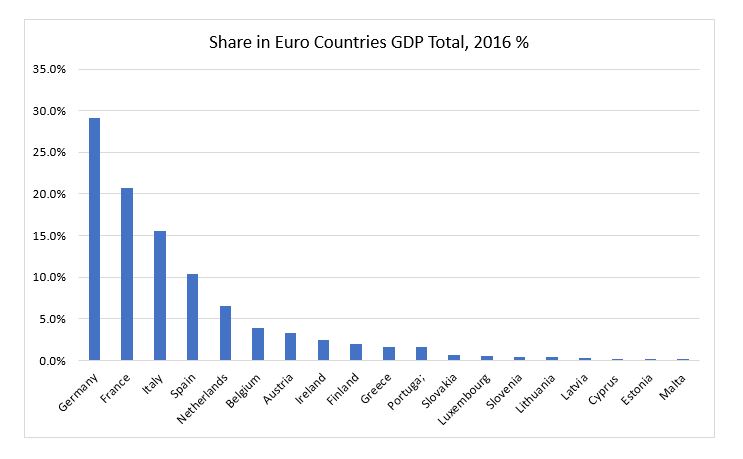
The Euro is the official currency of the European Union, and it is the second most traded and largest reserve currency in the world. The Euro has been adopted by 19 of the 28 member states. Of the 19 countries, the most predominant are Germany and France, as they have the largest economies in the EU bloc. In 2016, Germany alone contributed 21% of GDP within the EU, while France contributed 16%.
Although the USA is made up of 50 different states, most economic data is collected on an aggregate and represented at a national level. The same happens for data of the 19 Euro countries, but as data is also collected and released at a state level, we may get useful estimates for the Euro from data released by Germany and France.
As can be in the chart below, Germany and France contribute nearly 50% of GDP within the Euro countries. Their significant contribution to GDP and their political power within the EU make these two nations vitally important to keep abreast of for clues about the Euro’s direction.
Best Time to Trade EURUSD
Like most currency pairs, EUR USD trading happens around the clock, 24 hours a day, 5 days a week, as trading books from tier-1 banks pass from London to New York, and then to Tokyo.
This continuous trading desk environment guarantees the liquidity traders need to be able to enter and exit the market at any time. If you are a day trader, you would be most interested in trading the Euro when there is a likelihood of more volatility rather than less. Higher volatility may allow for your trading strategy to see its profit targets fulfilled more regularly.
Of course, depending on where you are based in the world, certain times will suit a trader better than others. However, there are some parts of the day when volatility will generally increase in the Forex markets and in particular the EURUSD pair. The most noticeable times of day are immediately after economic data releases or monetary policy statements after central bank meetings.
Most important economic data are released for the Euro at 10 am GMT. However, Germany and France usually release data just before that time. The timing of Euro data releases typically coincides with the opening of the London trading session which starts at around 7 am GMT.
Economic data from the US is released at various times throughout the day; the most important data is released before the stock markets open at 08:30 am EST. Other data is released in the following hours, and not later than 4:30 pm EST.
Central bank meetings are held more or less monthly, although not all meetings have a monetary policy decision-making process, and are therefore less likely to create volatility. You can see the schedule for economic data and central bank meetings on various forex news websites.
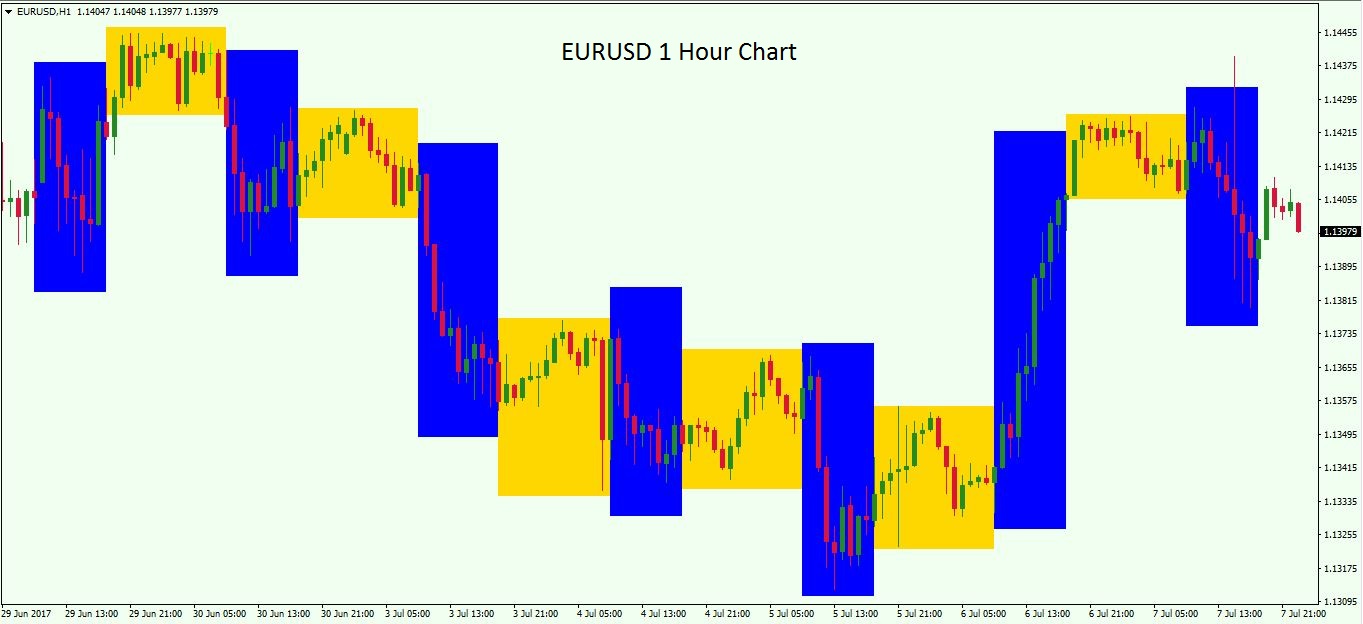
The chart above shows 7 trading session from June 29, 2017, on a 1-hour candlestick timeframe. We can see how Euro dollar trading tends to be more volatile through the periods outlined by the blue rectangles, compared to the periods in the hours outlined by the yellow rectangles. The blue rectangles are consistently taller, showing a wider trading range during those hours. The blue rectangles show the trading range from the London open at 7 am GMT to its close at 4 pm GMT; these trading hours overlap with the New York open which is at 12 pm GMT. The yellow rectangles display the rest of the New York trading session and the Tokyo session which starts at 6 pm EST.
Fundamental Factors Moving the EURUSD Currency Pair
Like all currency pairs, the fundamentals driving the appreciation of one currency over the other are defined by the strength of the two currencies’ economies. This is defined by the comparison of the two currencies’ GDP Growth rates, unemployment, and other important economic metrics. Usually, the currency whose economy is enjoying higher growth and lower unemployment will tend to appreciate against its peer.
Inflation and interest rates also play a major role in Euro dollar trading. Higher inflation with lower GDP Growth will weaken a currency in the long run. While the prospect of higher interest rates with similar GDP Growth will strengthen a currency compared to a currency with stable or lower outlook for interest rates.
It is necessary, therefore, to keep track of GDP Growth, unemployment and inflation. These three factors will provide a valuable fundamental framework for trading the EURUSD pair. US & Euro GDP Growth, as well as other economic data, can be easily tracked and compared on pertinent sites such as Tradingeconomics. This website is particularly useful as it allows you to compare historical data for one country against another.
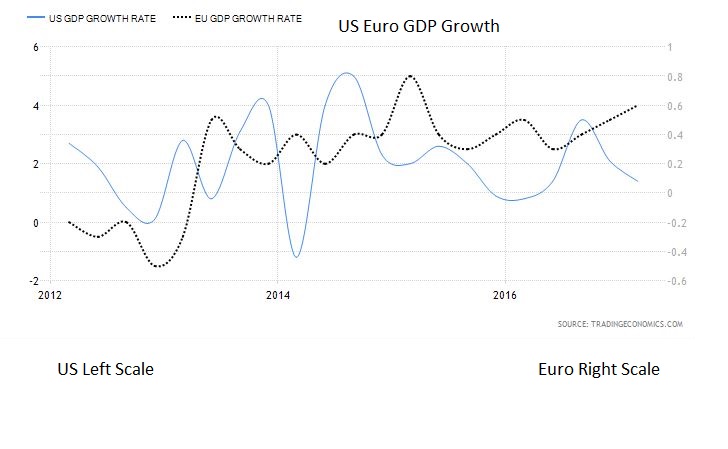
For medium term traders, who hold positions for days or weeks, these charts are essential to get a good idea of the underlying fundamentals for each currency. The chart above shows the US and Euro GDP Growth from 2012 to 2017.
For day traders, there are a series of data releases from the US and Europe that allow for a potential increase in volatility, which can provide for trading opportunities. Possibly the most important day of the month is Non-Farm Payrolls day. This data is the job creation number for the whole of the US and is greatly anticipated on the first Friday of every month at 08:30 am EST. It’s important to watch for unexpected data, as in all economic releases. The importance of this number in indicating how well the economy is performing means that any surprises from the forecast can cause large moves in price. Sometimes, these price moves may last only a few minutes or hours, so timely execution is critical.
Central bank policy making is also a big driver of EUR USD price movements. Both central banks’ policy meetings are widely anticipated, and the statements that follow can spark great bouts of volatility as the market adjusts price to new expectations. Higher interest rates will typically have positive, or bullish, effect on a currency, at least short term. On the other hand, a decrease in interest rates will usually see a currency depreciate short term.
This is explained by the fact that under like for like circumstances investors will prefer to hold a currency that pays higher interest than one that pays less, and many large institutions and hedge funds take advantage of these interest rate differentials thru currency carry trades.
The European Central Bank (ECB) meets, more or less, twice a month, where one meeting is scheduled as being a monetary policy meeting. The Fed meets, more or less, once a month.
Although the Fed meetings are potentially open to producing a change in monetary policy, changes usually only occur in March, June, September or December, which is when the Fed chair holds a press conference and issues a speech on monetary policy. This means that if a change in interest rates were made, it would be easier to communicate the reasons behind the change, and the assessment for future changes in the coming months.
Central bank policy meetings and the subsequent press statements can also increase volatility and may present shorter term traders an opportunity to jump on an emerging trend. If the policy statement uses wording that was not expected or seems to be hinting at a change in monetary policy, the EURUSD price can change rapidly within the space of a few minutes.
As the EURUSD currency pair is the most traded in the world, there are a large number of traders watching every important economic data release or monetary policy meeting that can affect its exchange rate. The data is available to everyone at virtually the same time. The ease of access to data means that surprises in data, more usual in US data, or changes in monetary policy can create large movements in price.
Typical Technical Strategies
We are now going to have a look at a couple of basic technical strategies that are often used in the EURUSD market. As with any technical strategies, these are not fool-proof, but rather, should be used as a starting point from which to build on your own ideas.
Triple Moving Average Crossover
The first strategy we are going to look at is the Three moving average cross-over. A moving average simply takes a specific period let’s say 21 days and calculates the average close price over that period – in this case the past 21 days. With each successive bar, it then takes the next 21 days and calculates the average close price, creating an average of price over the preceding 21 days. This strategy then creates two more moving averages, one with a longer period than 21, and another with a shorter period than 21.
A popular combination is the 55 and 13 period, coupled with the 21 period. As the 13-day moving average crosses, from below, above the 21-day and 55-day moving averages, it creates a buy signal. The buy signal is only confirmed once the 21-day signal also crosses above the 55-day moving average.
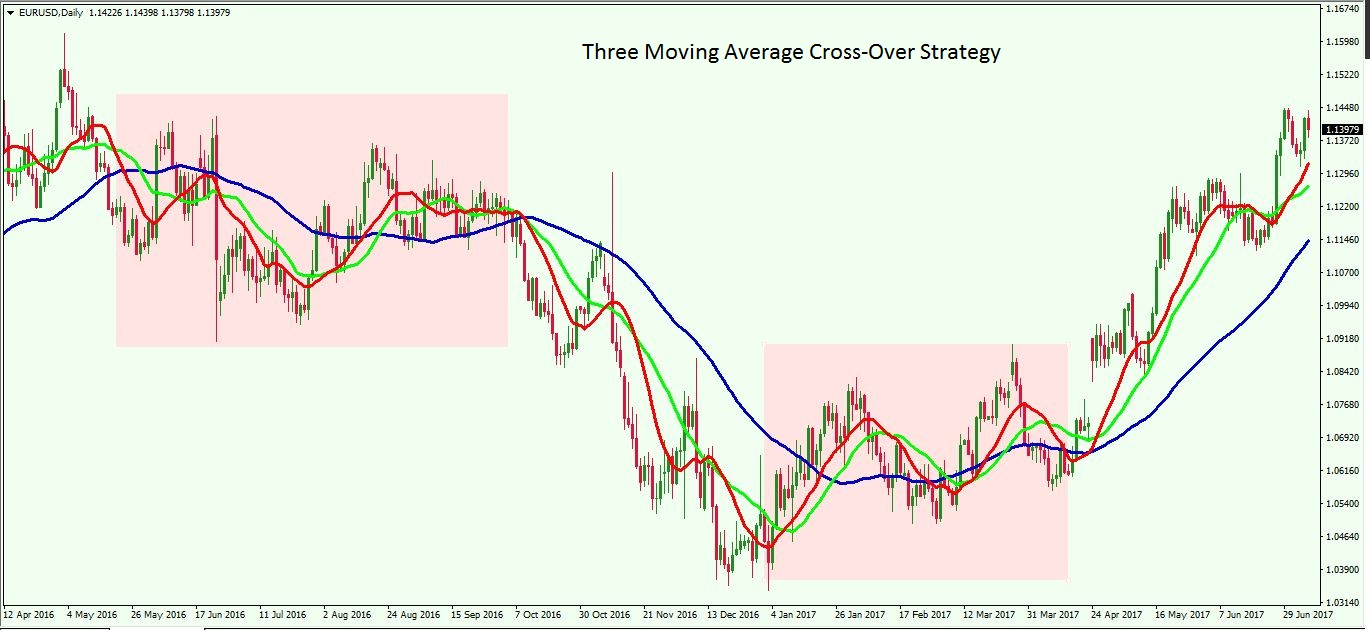
From the EURUSD chart above you can see that the strategy does not tend to do very well when markets are moving sideways. In the two pink rectangles, the EURUSD price traded within a substantially wide range, but still traded horizontally with no real trend in either direction. We can see how, after the first pink rectangle from the left, the strategy gave a sell signal in October 2013, which led way to a bear trend until the end of 2016. Price then started trading sideways in large swings through to April 2017, second pink triangle. By the end of April 2017, we can see the strategy signalled a new bull trend.
The numbers for the periods of each moving average can be optimized, but traders need to be careful of curve fitting the data. In addition, the longer the time frame, the more accurate this strategy tends to be, leaving it best suited for trading on daily charts. In any case, when the market is moving sideways, this type of trend following strategy will tend to give many false signals.
EURUSD Breakout Strategy
The next strategy we will look at is the Breakout strategy, also well-known and usually profitable when executed with discipline. This strategy can be used on any time frame, but it needs the formation of a tight rectangle chart pattern. This formation is more common on the 30-minute and 1-hour candle charts and is, therefore, best suited to these time frames.
The use of the exact time frame is a personal matter; however, keep in mind that the 30-minute chart will give you more opportunities but it is more likely to give more false signals, whereas the 1-hour chart will give you less opportunities but will result in less false signals.
The strategy is simple; you would look for rectangular shaped formations – these usually occur during the less volatile hours of the trading session, late New York afternoon and during the Tokyo session. When price moves out of the rectangle’s range, a breakout occurs, and a signal to buy or sell is created. For the signal to be confirmed price must close with the candle body outside of the rectangle’s range. When the candle body closes above the range, it creates a buy signal, and when it closes below the range it creates a sell signal.

From the above EURUSD 1-hour chart, we can see the various green rectangles which identify periods of sideways price action. You will notice that to the right of each rectangle price suddenly moves out of the rectangles range creating a buy or sell signal. The strategy can also be combined with other limits, such as maximum profit limit of 30, 40 or 50 pips or limited by a specific time of day, for example, 2 pm GMT. Confirmation of the signal can also be combined with time limits, for example, London or New York session open, such that if the trading session chosen has not opened the signal is not confirmed.
Scheduled News Events
To finish the list of Eurusd trading tips, we are going to have a look at scheduled news and its impact. The economic reports that typically move the market the most, are those in which the results differ from what the market place was expecting. It is necessary to have a clear view of the expectations the markets have about the Euro and the US dollar, in particular concerning interest rates, job creation, and GDP Growth. Any new data that deviates from the expected range can cause sudden and sharp price movements in the exchange rate.
As we pointed out earlier, investors tend to prefer to hold currencies, like for like, that pay higher interest rates. However, it is often possible to witness a rate hike, for example, by the US, and see the US dollar plunge as soon as the policy statement is released. This may happen as the market will have priced in more than what has actually been discounted.
If the EUR USD market had priced a rate hike plus more hawkish language for the policy statement, but only the first event happens then the headline news, “a rate hike” is not living up to the expectations the market had running into the event.
The same concept holds for economic data; if the market expected Non-Farm Payrolls to be released at 180k but the actual release is for 110k, we are very likely to see a sell-off in the US dollar in favor of the Euro. Some data releases also revise the prior month’s data release, as is the case with Non-Farm Payrolls. If the prior month’s revision is in the same direction as the data for the current month then the impact on the market will be magnified. That is, if the revision in the above case also lowered the prior month’s number of jobs, then the sell-off would be greater. Whereas, if the revision is higher in this case, then the impact on the market should be reduced.
Wrapping up
There are many factors that the EURUSD trader must be cognizant of, as there are important economic data releases coming out practically on a daily basis. Whether you are day trading or taking longer term positions, it’s important to try to keep abreast of all the major data releases, and central bank statements.
The comments and data have an immediate impact and can also indicate the medium-term trend. This can be vital to an intermediate-term traders’ decision-making. The market volatility created during European hours and the first hours of the New York session are typically the best times to place entry orders in the market, and daytraders can consider intra-day strategies during those hours. As always, it’s a good idea to mix technical with fundamental analysis to create the most effective trading strategy.