Correlation in finance is the statistical measure of how two different assets move in relation to each other. A positive correlation exists between assets that tend to move in the same direction. For example, a positive correlation is observed between the value of the Canadian Dollar relative to the U.S. Dollar and the price of crude oil expressed in U.S. Dollars. Conversely, a negative correlation exists between assets that typically move in opposite directions. Such a negative correlation usually exists between the EUR/USD exchange rate and the USD/CHF exchange rate, for example.
Currency correlations strongly influence the overall volatility of — and hence the risk involved in holding — a portfolio of forex currency pairs. As a result, learning how to use currency correlation is a key element of currency risk management for any serious forex trader to understand. To grasp the concept of forex correlation in currency pairs, the trader should first understand how market correlation affects the value of currencies.
Because of the fact that Canada is a major oil producer, its currency can be directly affected by fluctuations in the price of crude oil. If the price of crude oil appreciates, the increase in the price of the commodity will generally make the value of the Canadian Dollar rise against other currencies. The Canadian Dollar’s relative value is therefore positively correlated to the price of crude oil.
Conversely, the U.S. Dollar tends to be negatively correlated to the price of oil due to the fact that the United States is a net consumer of oil on the world market. Due to the market correlation of the individual currencies to the price of crude oil, an upwards spike in the oil price would tend to negatively affect the USD/CAD currency pair.
Currency pairs’ correlation arises out of the interdependence seen between currencies due to their being priced relative to one another and traded in pairs. For example, the EUR/GBP currency pair is a derivative of both the EUR/USD and GBP/USD exchange rates. Therefore, a trader that happens to take a long position in EUR/USD and a short position in GBP/USD has essentially taken a long position in EUR/GBP, due to their long and short USD positions, which effectively cancel each other out. Furthermore, the EUR/GBP exchange rate is correlated to the exchange rate of both component pairs versus the U.S. Dollar, being positively correlated to EUR/USD and negatively correlated to GBP/USD.
Forex Pairs Correlation: More About Positive and Negative Correlation
Forex currency pairs are made up of two national currencies, which are valued in relation to one another. A number of different elements directly affect the value between two nation’s currencies, such as the interest rate differential, the balance of trade between both countries and whether the country is a commodity producer or consumer to name just a few.
Currency correlation occurs when the exchange rate levels of two or more currency pairs often move in a consistent direction relative to one another. This can be a positive correlation, when the price or exchange rate level tends to move in the same direction or a negative correlation, which occurs when the exchange rate level tends to move in the opposite direction. Furthermore, a lack of correlation would occur if the currency pairs typically move independently in completely random directions over a certain period of time.
Positive Correlation – When two currency pairs move in the same direction – so if one pair moves up, then so does the other. For example, the correlation of EUR/USD and GBP/USD is positive because if the demand for U.S. Dollars increases, the level of both currency pairs will usually decline. Conversely, if the demand for U.S. Dollars falls, then the levels of both currency pairs will tend to increase.
Negative Correlation – Negative correlation is the opposite of positive correlation, with the exchange levels of currency pairs usually moving inversely to each other. For example, a negative correlation exists between the EUR/USD and USD/JPY currency pairs. When demand for U.S. Dollars increases, the currency pairs often move in opposite directions, with USD/JPY generally increasing due to the U.S. Dollar being the base currency in the pair, and with EUR/USD declining since the U.S. Dollar is the counter currency in that pair.
Because of the dynamic nature of world economics, changes in forex correlated pairs do occur and make the calculation of correlation between currency pairs very important to the management of risk in forex trading when positions in multiple currency pairs are involved. Changes in correlation can occur daily in some forex pairs, which can in turn affect the accuracy of a trader’s projections of long term correlations. Some of the reasons for variations in correlations include changes in each nation’s central bank monetary policies, sensitivity to crude oil or other commodity price fluctuations, and political and economic factors.
Importance of the Calculating Correlation in Forex Trading
Due to the fact that all forex trading involves pairs of currencies, there can be a significant risk factor in a forex portfolio in the absence of proper correlation management. Essentially, any forex trader taking positions in more than one currency pair is effectively taking part in correlation trading, whether they know it or not.
As an example of how correlation can increase the risk in trading two currency pairs, consider the situation where a trader has a two percent of account balance per trade risk parameter in their trading plan. If the trader takes a long position in EUR/USD and another long position in GBP/USD of the same U.S. Dollar amount, it would appear that they have assumed two positions with two percent risk for each. Nevertheless, the two currency pairs are strongly positively correlated in practice, so if the Euro weakens versus the U.S. Dollar, the Pound Sterling also tends to weaken versus the U.S. Dollar as well. Hence, the overall risk assumed by the trader would be the rough equivalent of four percent risk taken in either GBP/USD or EUR/USD.
Conversely, if the trader assumes a short position in EUR/USD and a long position in GBP/USD, the risks inherent in each trade will tend to cancel out to a certain degree due to the positive correlation of the two currency pairs. Opening opposite positions in currency pairs that are strongly positively correlated can be something of an imperfect hedge, since the overall risk of the portfolio is reduced.
Calculating Correlation in Forex Currency Pairs
Correlations between currency pairs are inexact and depend on the ever changing fundamentals underlying each nation’s economy, central bank monetary policy, and political and social conditions. Currency correlations can strengthen, weaken or in some cases, break down almost entirely into randomness.
In the financial world, correlations are typically quantified and displayed in a forex correlation table using a scale that varies from +1 to -1 where:
- 0 – is equal to no correlation. Hence, two currency pairs having zero correlation implies that the two pairs will behave in a completely random and independent manner from each other.
- +1 – is equal to a fully positive correlation and implies that two currency pairs will generally move in the same direction 100 percent of the time.
- -1 – is equal to a negative correlation, which means that the two currency pairs will generally move in opposite directions 100 percent of the time
The currency correlation table shown below for illustration purposes was computed on April 19th, 2016. It can be used to quickly gauge the correlation between several different currency pairs for time frames from one hour to one year:
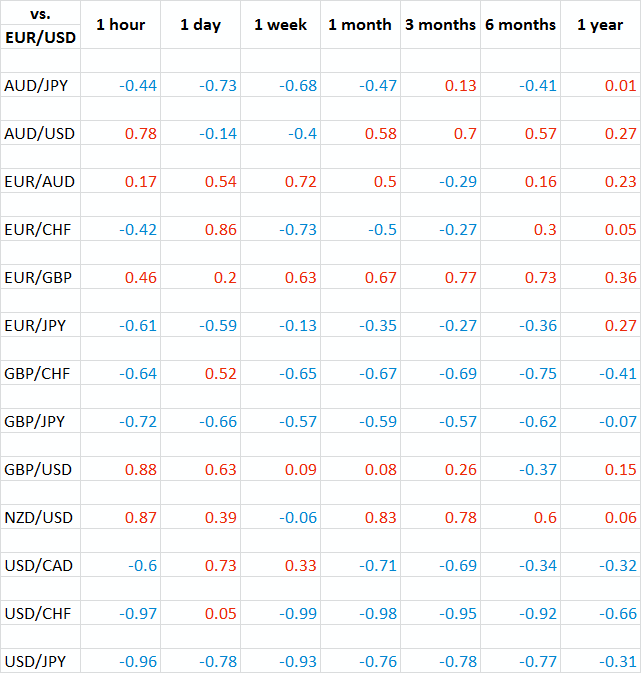
How to Read the Table
Each cell of the sample currency correlation table shown above shows the correlation coefficient computed between the exchange rate of the currency pair shown in the vertical column to the left and the EUR/USD exchange rate observed over the time period shown in the corresponding horizontal row above the table. Furthermore, each correlation coefficient is color coded, where red indicates a positive correlation between the currency pairs and blue indicates a negatively correlation.
A positive correlation shown in red means that the currency pairs tend to move in the same direction. In other words, when the exchange rate for one pair goes up, the exchange rate for the other pair also typically goes up. A negative correlation shown in blue means that the two currency pairs tend to move in the opposite directions.
The following categories provide a quick way of interpreting the correlation table’s values.
- 0.0 to 0.2 – Very weak correlation, movements are essentially random
- 0.2 to 0.4 – Weak or low correlation of little significance
- 0.4 to 0.7 – Moderate correlation
- 0.7 to 0.9 – Strong to high correlation
- 0.9 to 1.0 – Very strong correlation, movements are related to each other
How Correlation Coefficients are Calculated
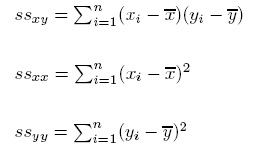
The correlation coefficient for two exchange rates is generally calculated using the following mathematical formula:
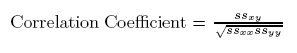
Where:
To calculate simple correlations yourself, you can use a regular computer spreadsheet program such as Microsoft’s Excel. Excel has a correlation function that can be entered into a cell of a spreadsheet as follows:
=CORREL(range1, range2).
You can then list the time frames horizontally along the top row of the table, such as one month, three months and six months.
Varying the time frame of the correlation readings tends to give a more comprehensive look at the differences and similarities of the correlation between currency pairs over time.
Below are the individual steps you can take when setting up your correlation spreadsheet:
- Obtain the pricing data for the two currency pairs that you are analyzing
- Make two columns with a label for each currency pair, filling the columns with the exchange rates observed over the time period to be analyzed
- Once the data is input, enter =CORREL( at the bottom of each column
- Highlight all the data in one of the price columns that will give you a range of cells in the formula box.
- Type in a comma
- Repeat the 3rd through 5th steps with the other currency pair
- Close the formula, leaving it looking like =CORREL(A1:A30, B1:B30) where A1:A30 is the selected range containing 30 observations for the first currency pair, and B1:B30 is the selected range containing the corresponding 30 observations for the second currency pair. The number produced by the formula will be the correlation between the two currency pairs.
 Utilizing Correlations in Forex Trading
As mentioned previously, when trading more than one currency pair, a forex trader is either knowingly or unknowingly involved in forex correlation trading. One way of applying a forex correlation strategy in your trading plan is by using correlations to diversify risk. Instead of taking a large position in just one currency pair, a trader can take two smaller positions in moderately correlated pairs, thereby somewhat reducing their overall risk and not putting all of their eggs into one basket.
By the same token, the forex trader could establish two positions in strongly correlated pairs to increase their risk, while also increasing potential profits if the trade is successful. Using correlation in forex trading also makes a trader more efficient, since they would tend to avoid holding positions which might ultimately cancel each other out due to negative correlation unless they wanted to have a partial hedge.
Risk managers overseeing forex risks for large corporations with operations in many countries often use a forex correlation chart to determine how to best hedge the company’s foreign exchange exposure. When applied to the company’s different foreign operations, such a currency correlation chart can help show a risk manager how to best offset their company’s foreign exchange exposure by using forwards, futures and option trades.
Forex Trading Strategies Involving Correlation
Forex traders make use of a number of strategies using correlation. One such strategy involves two strongly correlated currency pairs such as GBP/USD and EUR/USD. The strategy is used in a time frame of 15 minutes or more. The forex trader waits for the correlated pairs to fall out of correlation near a major support or resistance level.
Once the two pairs have fallen out of correlation, one pair will tend to follow the other after a significant reversal. Accordingly, a possible trading strategy would be to generate a buy signal if one of the two pairs fails to make a lower low or a sell signal if one of the pairs makes a higher high.
Other trading strategies might involve confirmation of reversals and continuation patterns using strongly correlated currency pairs. For example, if the U.S. Dollar is strengthening overall, EUR/USD should begin to sell off. At that point, a decline seen in GBP/USD would confirm the U.S. Dollar downtrend, with a decline in AUD/USD further confirming the Dollar down move. A variation on the above strategy might involve avoiding entering into a trade if two other strongly correlated currency pairs fail to confirm the reversal or continuation pattern observed in the target currency pair.
Traders in the forex market can also use correlation to diversify their portfolios. For example, instead of buying two GBP/USD contracts, the trader could buy one GBP/USD contract and one AUD/USD contract, since those pairs are both positively correlated, although imperfectly. The imperfect correlation allows for lower risk exposure and adds diversification to the trader’s portfolio due to the Australian Dollar being substituted for the Pound Sterling in one contract.
Inherent Risks in Using Correlation in the Forex Market
Since the 2008 financial crisis, correlations for major and minor currency pairs have been in a constant state of flux. Socio-political issues, as well as sudden changes in monetary policy taken by central banks in some countries, have altered or reversed traditional correlations for some currency pairs.
In addition, the recent slide in oil and commodity prices has made previously weaker correlations significantly stronger in certain currency pairs involving the commodity currencies like AUD, CAD and NZD. Another recent event that took the entire forex market by surprise was the Swiss National Bank’s move to end its self-imposed floor on the Euro’s exchange rate against the Swiss Franc in January of 2015. The event significantly changed numerous correlations, albeit temporarily for some currency pairs.
The forex market is currently facing negative benchmark interest rates in Japan and the Eurozone, and a weak recovery in the United States as the Fed gradually raises interest rates. In addition, the market is dealing with a possible exit by Britain from the European Union and extreme volatility in the crude oil and commodities markets.
While sudden changes in correlations can present significant risks when trading currencies, the sudden changes can also be used to a trader’s advantage. Same direction positions in strongly correlated currency pairs can be used to compound profits and time entry and exit points, while opposite positions can be taken in strongly negatively correlated currency pairs to increase profits in the event of a major market move.
Essentially, being aware of currency correlations can only make you a better trader, irrespective of whether you are a fundamental analyst or technical analyst. Understanding how the various currency pairs relate to each other and why some pairs move in tandem while others diverge significantly allows for a deeper understanding of the forex trader’s market exposure. Using currency pair correlation can also give forex traders further insight into established portfolio management techniques, such as diversifying, hedging, reducing risk and doubling up on profitable trades.