I am sure you have heard about chart patterns in Forex trading and their relation to technical analysis. You probably know about Double and Triple Tops, Head and Shoulders, or Rectangles. In order to have a complete understanding of chart pattern trading, we should also gain a good understanding of one of the most common on-chart formations. What I referring to are the triangle trading patterns. So in this lesson, we will discuss the basic triangle formations and some ways to properly identify and trade these patterns.
What is a Triangle Chart Pattern
The triangle pattern is a specific figure formed on the price chart, typically identified when the tops and the bottoms of the price action are moving toward each other like the sides of a triangle. When the upper and the lower level of a triangle interact, traders expect an eventual breakout from the triangle. As such, many breakout traders use triangle formations for identifying breakout entry points.
There are different kinds of triangles that can be seen on a Forex chart. Before you jump into triangle trading you should understand the difference between the formations. We will now take a closer look at the various triangle chart patterns and the corresponding trade setups. Once you are equipped with this knowledge, you should be able to add a triangle trading strategy to your trade setup arsenal.
Ascending/Descending Triangle
These types of triangles have one flat horizontal side, and one sloping side, which is moving toward the flat horizontal side. The Ascending and Descending Triangle patterns are a mirror image of each other. They are identified as Ascending or Descending depending on which side is the flat horizontal side, and which side the slope is on.
Ascending Triangle Pattern
This triangle pattern has its upper side flat, and the lower one ascending. In this manner, the tops of this triangle are on the same level and the bottoms are increasing. This type of triangle typically has a bullish character. When you spot this triangle on the chart, you should be prepared to catch a bullish price move equal to at least the size of the triangle. In this manner breakouts through the upper level (the flat side) are used for setting entry points for long positions. This is a sketch of the ascending triangle chart pattern:
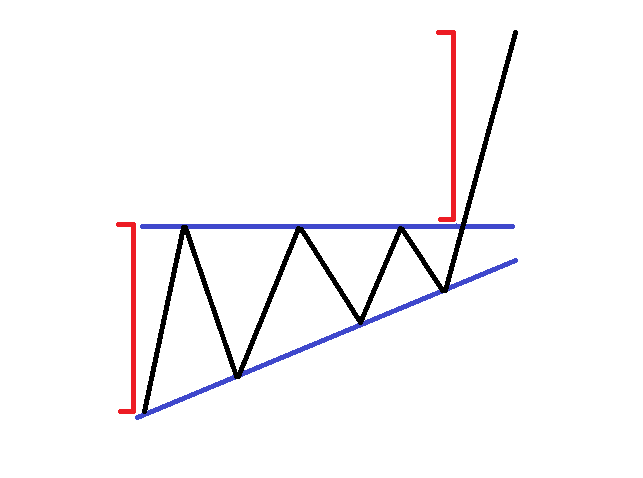
The black lines above indicate the price action within the triangle formation. The blue lines refer to the sides of the triangle, which contains the price action. The red lines correspond to the size of the triangle and its potential target, which is typically a 1:1 measured move. When an ascending triangle is formed during a bullish trend, we expect a continuation of the trend.
Descending Triangle Pattern
As noted earlier, the ascending and descending triangles are a mirror image of each other. As such, the descending triangle pattern has the opposite characteristic. The flat side of the descending triangle is below the price action. The upper side of the triangle is inclined downwards. In a bearish market, the descending triangle has a bearish potential equal to at least the size of the pattern. For this reason, the descending triangle is used to open short positions after the price has broken its lower (flat) side. Let’s see the sketch of the descending triangle:
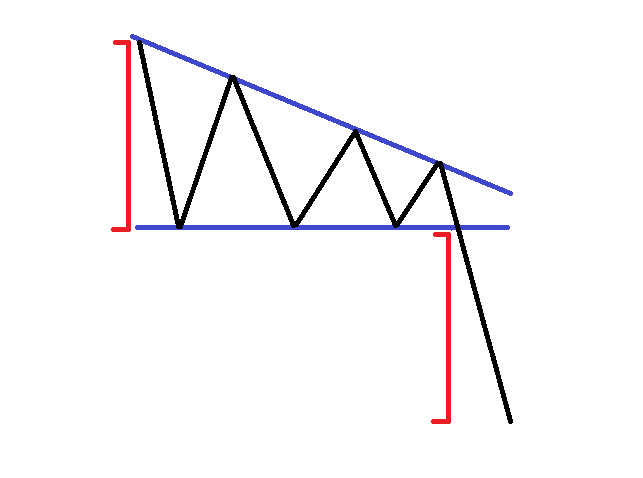
When the descending triangle is created during a bearish price tendency, we expect the trend to continue.
It is very important to mention that the ascending and the descending triangles sometimes break through the inclined level, causing false signals and trapping some traders along the way. The same holds true for the horizontal price zone. You should always try to wait for the close of the candle to confirm the breakout. This will help reduce many of the false signals.
Rising/Falling Wedge
The rising and falling wedges are similar to the ascending and the descending triangle patterns. However, the rising and the falling wedges have no flat side. Both sides of the wedges are sloping in the same direction. Let’s describe the two kinds of wedges you will find on the price chart.
Rising Wedge
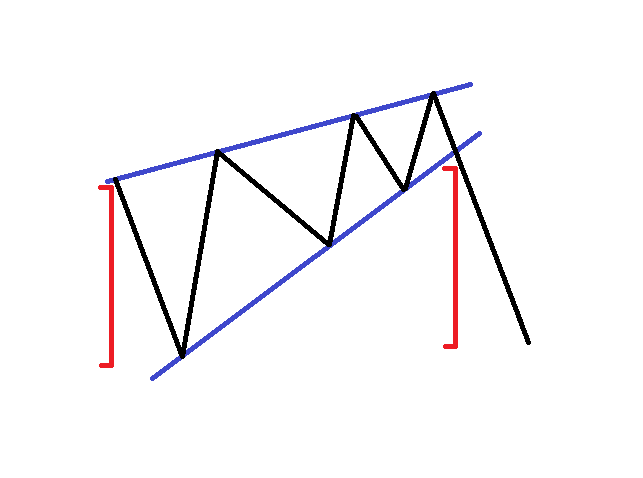
This is a triangle chart pattern, where both sides are inclined upwards. The price creates higher tops and even higher bottoms. This causes the two ascending lines to interact, creating a type of triangle pattern on the chart. The rising wedge has a strong bearish character. In this manner, the trigger side of the wedge pattern is the lower line. When you spot a breakout through the lower level of a rising wedge, you should expect a sharp price drop equal to at least the size of the pattern. Therefore, breakouts through the lower level of a wedge are used for opening short positions. This is what the rising wedge formation looks like:
Falling Wedge
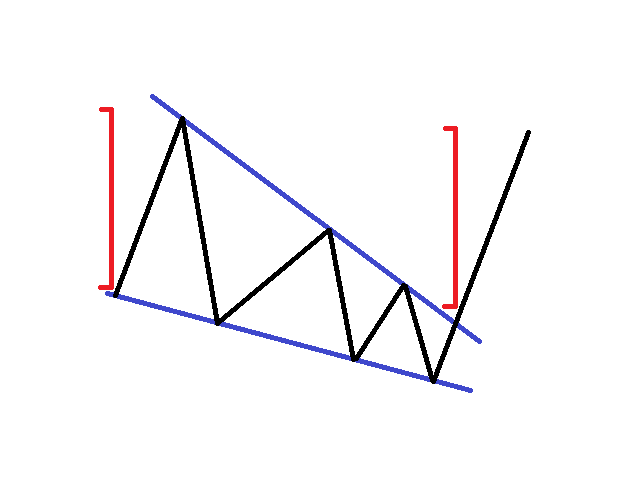
With the falling wedge pattern, both sides are inclined downwards. The price creates lower bottoms and even lower tops. In this manner, the two sides of the triangle are descending and contract to a tight point. Opposite to the rising wedge, the falling wedge has a strong bullish character. Therefore, the trigger side of the falling wedge formation is the upper line. When the price breaks the upper level of a falling wedge, you should aim at for a bullish move at least as large as your wedge formation. As such, traders use the falling wedge to set long entry points on the chart. Below you will see a sketch of a falling wedge:
Now that you know what the rising and the falling wedges look like, we should share one more detail regarding these formations. Wedges could have trend continuation, or trend reversal character. When the wedge appears after an extended price move, we expect a reversal of the trend, when the wedge appears earlier in the trend, we expect it to be a temporary retracement that will continue the main trend in place. Typically the more powerful wedge formation is the potential trend reversal formation which occurs after a prolonged trend move.
Symmetrical Triangle Pattern
The symmetrical triangle is a situation on the chart where the tops of the price action are lower and the bottoms are higher. Also, the two sides of the triangle are inclined with the same angle. This creates the symmetrical character of the triangle.
Typically with a symmetrical triangle pattern, the expected directional breakout is unknown. The reason for this is that the bullish and the bearish move have equal strength as seen thru the price action.
When a breakout eventually occurs, it is likely to provoke a price move equal to the size of the pattern. Therefore, you should carefully identify a potential breakout in the upper and the lower level of the symmetrical triangle in order to take the right position in the market. The sketch below illustrates the symmetrical triangle formation and possible breakout scenarios:
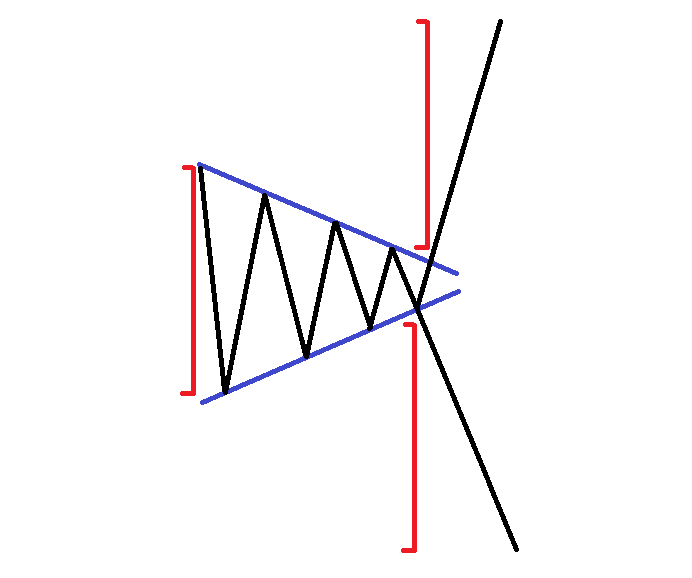
As you see from the example above, the potential target is based on the size of the triangle formation. With this type of measured move analysis, you will know what to expect from the symmetrical triangle breakout, whether it breaks upwards, or downwards.
Pennants
Pennants on the chart have a similar shape to that of symmetrical triangles. They typically appear during trends and have a trend continuation character.
Bullish Pennant
The bullish pennant is similar to a symmetrical triangle in appearance, but the Bullish pennant formation comes after a price increase. Since pennants have trend continuation character, the bullish pennant is likely to continue the bullish trend on the chart. When the upper side of the pennant gets broken upwards, we are likely to see an increase equal to at least the size of the pennant, and typically larger.
And so when trading pennants, a second target should also be used to catch a larger move. When calculating the second target, you would analyze the price leg immediately following the pennant. You could set the target to 1:1 of the previous leg or .618 of that leg. When the trend seems strong and has a steep slope a 1:1 measured move would be an appropriate second target, and in all other cases the .618 of the leg could be used. Let’s take a look at the bullish pennant below:
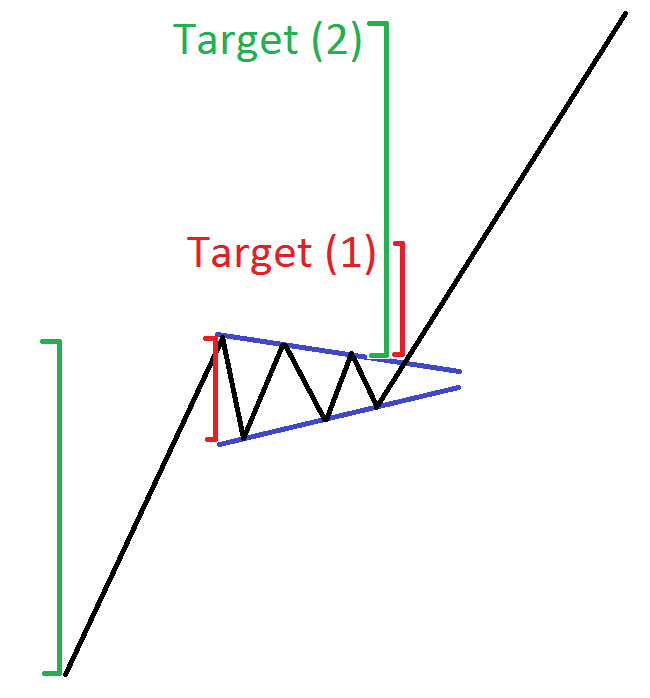
See that here we have two targets. The red target is the first one, which is as big as the size of the pennant. The green target corresponds to the size of the previous up move, which should be applied starting from the upper side of the pennant.
Bearish Pennant
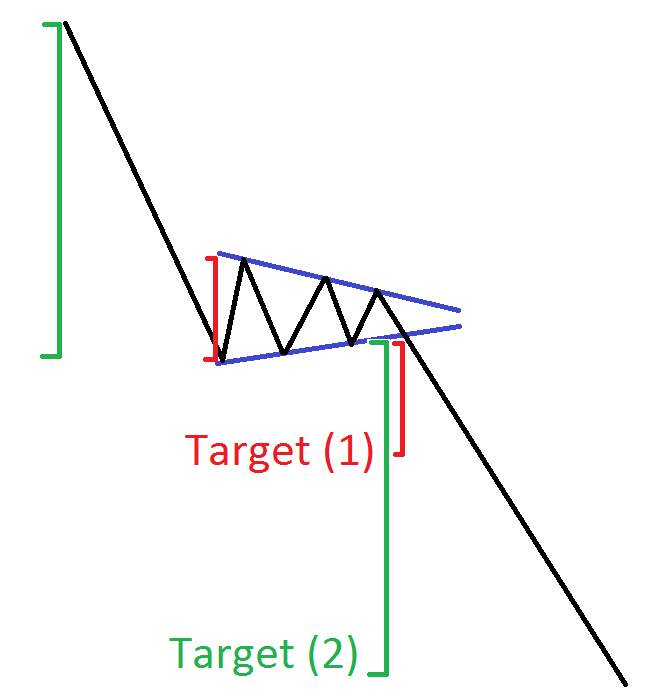
As you have probably guessed, the bearish pennant is the mirror image of the bullish pennant. Bearish pennants start with a price decrease and end up with a symmetrical triangle appearance. Since pennants have trend continuing character, bearish pennants are likely to continue the bearish trend.
When the price goes through the lower level of the bearish pennant, you should first look to capture the first target, which is equal to the size of the pennant itself. When the price completes this target, you can then try to catch the expected further decrease, which is equal to the size of the previous leg or .618 of that leg. Refer to the image below for a Bearish Pennant:
Expanding Triangle
You can hardly mistake an expanding triangle on the chart. The reason for this is that it has very unique parameters. Both sides of the expanding triangle are inclined, but in opposite directions.
The direction of the potential price move of this chart pattern is very tricky to determine. Therefore, we will now introduce a few rules, which will help you to identify the direction of the expected price move.
Symmetrical Lines
If the expanding triangle is a horizontal mirror image of a symmetrical triangle, then you should trade the formation as a trend continuation pattern. The image below shows a sketch of an expanding triangle with symmetrical lines:

Increasing Lines
If the two sides of the expanding triangle are increasing, then the pattern is likely to have bearish character.
Decreasing Lines
If the two sides of the expanding triangle formation are decreasing, then the figure is likely to have bullish potential.
One Side Stronger than the Other
If the tops of the price action are increasing, but the bottoms are decreasing with higher intensity, then the pattern has bearish character. On the contrary, if the bottoms are decreasing, but the tops are increasing with higher intensity, then the pattern is likely to have bullish character. In other words, you should trade in the direction of the side, which has higher inclination.
Trading Triangles in Forex
Now that we have discussed most of the important triangle patterns in Forex, I will now show you how a triangle trading system could work.
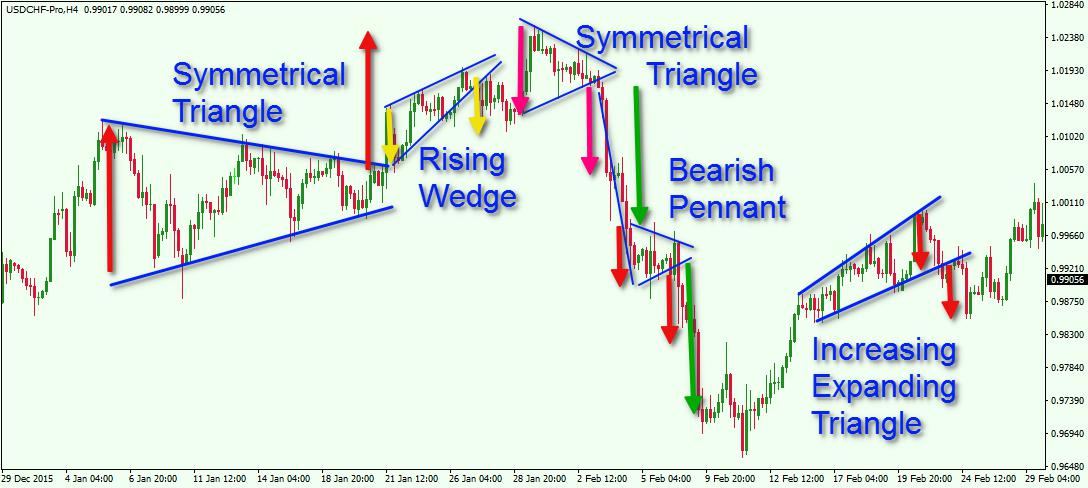
The image above shows the H4 chart of the USD/CHF Forex pair for Jan – Feb, 2016. The chart illustrates five triangle examples and their potential outcome.
The chart starts with a big symmetrical triangle. The price creates three decreasing tops and three increasing bottoms on the chart. The red arrow in the beginning of the triangle measures its size. As you see, the same red arrow is applied when the price breaks the upper level of the triangle. The red arrow indicates the potential target of the pattern, which gets completed after a week.
Meanwhile, on the way up the price action creates a rising wedge chart pattern. As we discussed, the rising wedge has bearish potential. With the the breakout through the lower level of the wedge we notice a minor correction. (yellow arrows)
At the end of the bullish tendency the price creates another symmetrical triangle. Later on the price breaks through the lower level and completes the size of the pattern (pink arrows).
While decreasing, the price action actually creates a bearish pennant. This is the consolidation after the first impulse of the bearish trend. The price breaks the lower level of the pennant afterwards. On the way down we see the price completing the first target, which equals the size of the pennant (red arrows). Then the decrease continues and the decrease is extended to a size equal to the previous leg. (green arrows).
The USD/CHF then creates a double bottom reversal pattern and switches to a bullish direction. On the way up the price action creates an expanding triangle pattern. Notice that both the upper and the lower level of the pattern are increasing. In this case, the expected price move is bearish and should be equal to the size of the pattern. Notice that this time the size of the pattern is measured from the ending side of the formation. The reason for this is that we take the widest side when we measure the expected move from the triangle breakout. The red arrows on the chart show us that this pattern also completes its target.
Conclusion
- Triangles are among the most important chart patterns in Forex trading.
- You have a contracting triangle on the chart when the tops and the bottoms of the price action are moving toward each other.
- The basic Forex triangles are:
- Ascending Triangle – flat tops; higher bottoms; bullish potential;
- Descending Triangle – flat bottoms; lower tops; bearish potential;
- Wedges – sides increase/decrease in the same direction;
- Rising Wedge – higher tops; even higher bottoms; bearish potential;
- Falling Wedge – lower bottoms; even lower tops; bullish potential;
- Symmetrical Triangle – lower tops; higher bottoms; sides have the same angle of movement
- Bullish Pennant – comes after price increase; ends with a small symmetrical triangle; bullish potential
- Bearish Pennant – comes after decrease; ends with a small symmetrical triangle; bearish potential;
- Expanding Triangle – sides move against each other. The potential of the expanding triangle varies depending on the lines inclination:
- Sides are Symmetrical – the potential price move is in the direction of the trend.
- Both Sides are Increasing – bearish potential
- Both Sides are Decreasing – bullish potential
- One Side is Steeper than the other – the potential price move is in the direction of the steeper side.