When trading forex, many traders use different indicators in order to get additional confirmation for their signals. The primary indicator that a trader should use is Price itself, because Price action will provide you the clearest picture and get your closest to what’s happening in the market at any given time. Having said that, there are times when you should combine price action analysis with traditional technical indicators. Typically, you would look for clues between the indicator and price action in order to make a decision. One of the most powerful trading signals that combines price action analysis with the use of indicators is the Divergence signal, and that’s what we intend to discuss in this lesson.
Divergence Trading Patterns
The name of this pattern speaks of its character. We have a divergence when the price movement is contrary to the indicator movement. This type of Regular Divergence pattern comes in two forms:
Bearish Divergence
This is when price creates higher tops on the chart, while your indicator is giving you lower tops. After a bearish divergence, price usually makes a rapid bearish move. Notice that this happens despite the previous bullish attitude in the price.
Bullish Divergence
The bullish divergence has absolutely the same characteristics as the bearish divergence, but in the opposite direction. We have a bullish divergence when the price makes lower bottoms on the chart, while your indicator is giving you higher bottoms. After a bullish divergence pattern, we are likely to see a rapid price increase.
However, there is a third kind of a divergence, which does not fall into the regular divergence group. This is the Hidden Divergence pattern.
Hidden Bullish Divergence
We have a hidden bullish divergence when the price has higher bottoms on the chart, while the indicator is showing lower bottoms.
Hidden Bearish Divergence
As you probably guess, this type of divergence has the same character as the hidden bullish divergence, but in the opposite direction. We confirm a hidden bearish divergence when the price is showing lower tops, and the indicator gives higher tops.
The regular divergence pattern is used to forecast an upcoming price reversal. When you spot a regular bullish divergence, you expect the price to cancel its bearish move and to switch to an upward move. When you see a regular bearish divergence, you expect the price to cancel its bullish move and switch to a downward move.
Divergence trading is an extremely effective way to trade Forex. The reason for this is divergence formations are a leading signal. This means that the divergence pattern is likely to occur before the actual move. This way, traders are able to anticipate and enter a trade right at the beginning of the new emerging move.
Reliable Indicators for Trading Divergences
Since we discussed the four types of divergence patterns, we will now talk about the importance of the divergence indicator. As I said, you need an indicator on your chart in order to discover divergence. The reason for this is that the price has to be in a divergence with something. It is simply impossible to trade divergence without having an extra indicator on the chart. So the question becomes, which indicator or indicators are best for divergence trading? Well let’s find out.
Moving Average Convergence Divergence (MACD)
The MACD is a moving average based indicator, where a signal could be taken on a crossover. In this manner, the indicator basically has a lagging character. However, the lagging character of the MACD concerns only its primary signal – the crossover signal. The indicator also has two leading functions.
The first one is its ability to spot extended market conditions when the lines are approaching overbought / oversold readings.
The second one concerns MACD for divergence trading. When the MACD tops/bottoms are in the opposite direction from the price’s tops/bottoms, we have a divergence. Although the MACD is a lagging indicator in general, the divergence signal it gives us, is considered to have a leading character. Thus, we can get an early entry based on a MACD divergence, and then confirm the signal with a MACD crossover for example. The image below will show you how MACD divergence trading works.
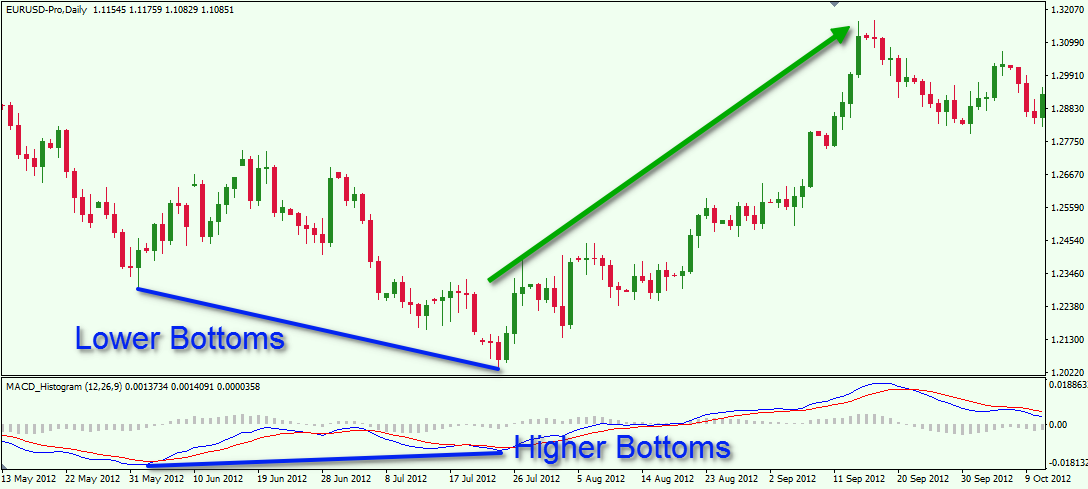
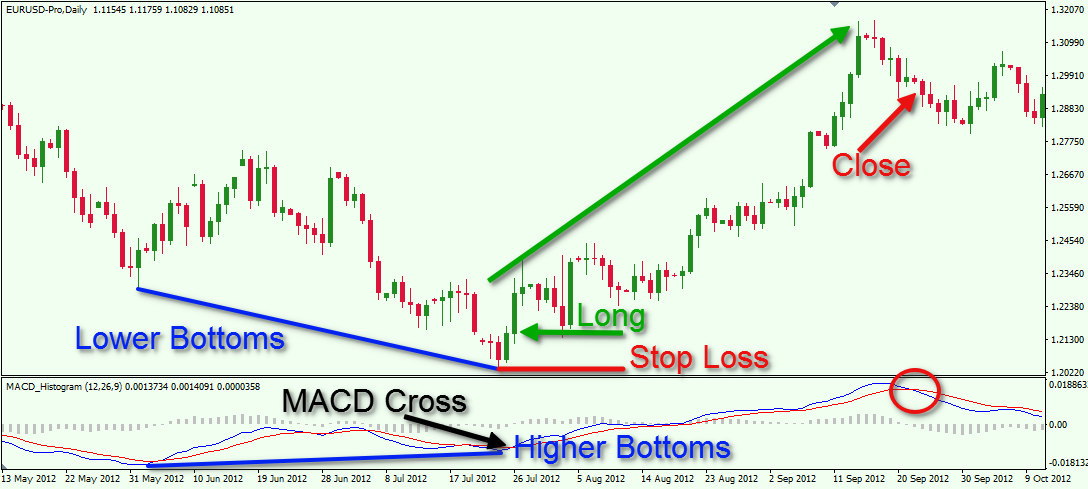
Above you see the daily chart of the most highly liquid Forex pair – the EUR/USD. At the bottom of the chart we have the MACD indicator, which is used to spot a bullish divergence. The blue lines on the chart show the divergence itself.
Notice that on the chart the EUR/USD closes with lower bottoms. At the same time, the MACD creates higher bottoms. This causes a bullish divergence between the price action and the Moving Average Convergence Divergence (MACD) indicator.
This scenario provides a nice opportunity for a long position. As you see, the EUR/USD price starts increasing right after confirming the bullish divergence.
Stochastic Oscillator
Another common oscillator used for divergence trading in Forex is the Stochastic Oscillator.
The Stochastic consists of two lines which interact frequently between each other. At the top and the bottom of the indicator there are two areas – overbought and oversold areas. The Stochastic indicator can be used for overbought and oversold readings. This is its primary purpose. However, the Stochastic Oscillator is an excellent tool for recognizing divergence trade setups.
In order to find a divergence between price action and Stochastic, you should look for discrepancies between the price direction and Stochastics tops or bottoms. It acts the same way as with the MACD.
However, the Stochastic Oscillator is likely to give us many more divergence signals than the MACD. The reason for this is the dynamic character of the Stochastic. It simply gives more opportunities than the MACD.
However, since the signals can be more frequent, many of them might be false signals which need to be filtered out. Have a look at the image below.
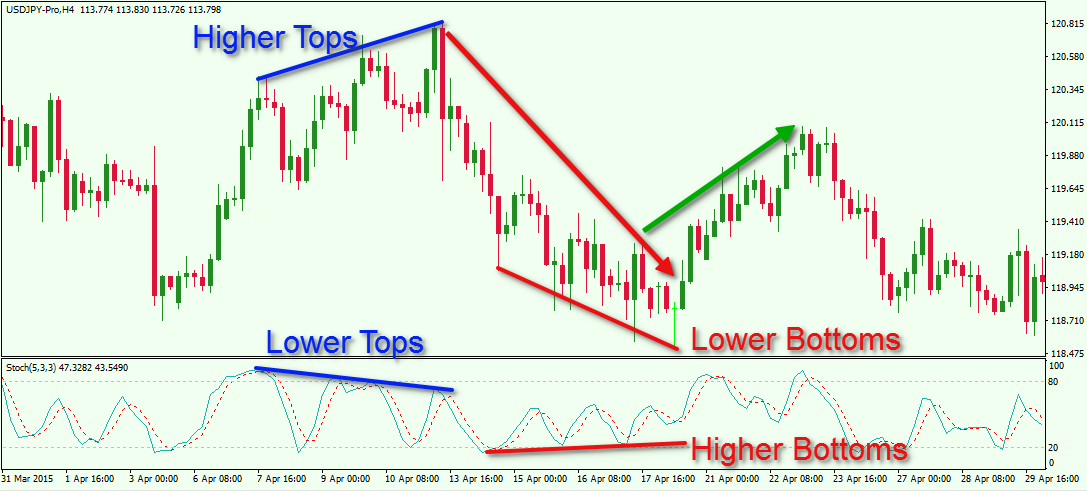
Above you see the 240 minute chart of the USD/JPY currency pair. There are two divergences on the chart, which gives an opportunity for two trades.
We start by analyzing the first case. We observe higher tops on the chart, while the Stochastic Oscillator creates lower tops. This confirms a bearish divergence on the USD /JPY. The price starts decreasing afterwards.
During the decrease, the USD/JPY price closes with lower bottoms. However, the Stochastic suddenly starts closing with higher bottoms. This is the second divergence pattern. Soon afterwards, the USD/JPY price starts increasing.
Relative Strength Index (RSI)
The Relative Strength Index is another good indicator to build a successful Forex divergence system. The primary function of this indicator is to discover overbought/oversold price conditions.
The RSI indicator consists of a single line, which moves between an overbought and oversold zone. In this manner, the RSI has a leading character. It is an oscillator like the Stochastic. Therefore, it is a good tool for spotting divergences on your chart.
When you find a mismatch between price action’s tops or bottoms and RSI’s tops or bottoms, you have a divergence pattern forming. If you spot the pattern, it will provide for an early entry signal for your trade.
The image below will show you how to trade divergence with the RSI indicator.
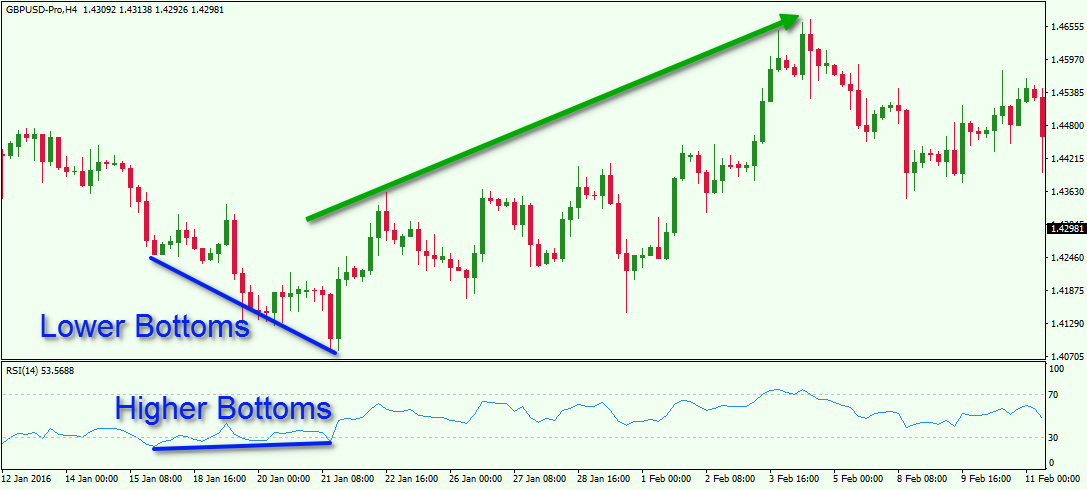
This is the H4 chart of the GBP/USD. At the bottom of the chart you see the Relative Strength Index indicator. The chart shows lower bottoms, while the RSI shows higher bottoms. This means that we have a confirmed bullish divergence on the chart, which provides an opportunity for a long trade on the GBP/USD Forex pair.
Momentum Indicator + Bollinger Bands
Let’s discuss another trading setup using Momentum and Bollinger Bands, which is well suited to trade divergence. We will use the Momentum Indicator to spot divergence with the price action. However, we will enter trades, only if the price breaks the Moving Average of the Bollinger Bands and the bands are expanding at the same time. This way we will get confirmation for our signals and we will enter trades only during high volatility. We will exit our trades when the price crosses the Moving Average of the Bollinger Bands in the opposite direction.
This is how this strategy works:
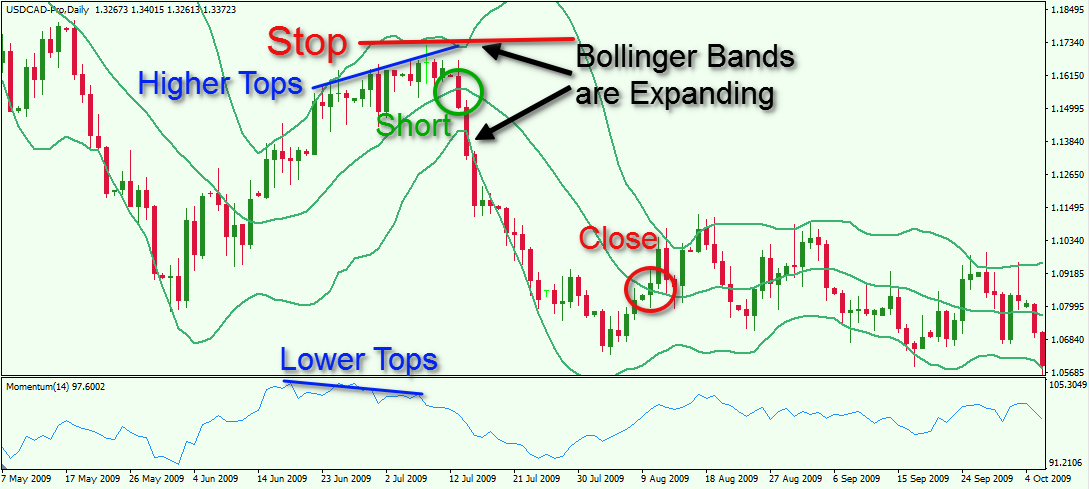
This is the daily chart of the USD/CAD. At the bottom of the chart you see the Momentum Indicator. On the price chart you see the Bollinger Bands overlay in green.
After a period of price increase, the Momentum Indicator starts recording lower top while price is making higher highs. This is a bearish divergence between the price action and the Momentum Indicator. Then, we see a large bearish candle, which breaks the Moving Average line between the bands. At the same time, the Bollinger Bands start expanding, indicating higher volatility. Subsequently we see a price drop of about 8% over the next three weeks. The short trade in this case could have been closed out when price breaks the Moving Average of the Bollinger Bands in bullish direction.
The proper location of a stop loss order in this trade should be above the last top of the price action prior the price break at the center Bollinger band line. As you can see the risk was very nominal in relation to the overall profit that could have be realized from this trade.
Money Management when Trading Divergences in Forex
We have discussed the types of divergence patterns and some reliable indicators to trade divergence with. Now we know how to spot divergence and how to enter the market on a divergence. However, before you start trading divergence setups, there are a few more points which we need to discuss further. These things include an example money management approach when trading divergence setups. If you do not have a sound money management plan you are likely to lose money trading divergences or any other setups for that matter.
Stop Loss when Trading Divergence
Regardless of the trading method you use, you should always use a Stop Loss order for each of your trades. It is no different when you trade divergences. And for most traders, it is best to place a hard stop in the market instead using a mental stop. As far as the divergence setup goes, one way to place your stop loss would be put it right above the last top on the chart, which confirms the bearish divergence. If the divergence is bullish, then we rely on bottoms and the stop should be placed below the last bottom on the chart.
The image below will give you an idea of where to put your stop loss when trading divergence.
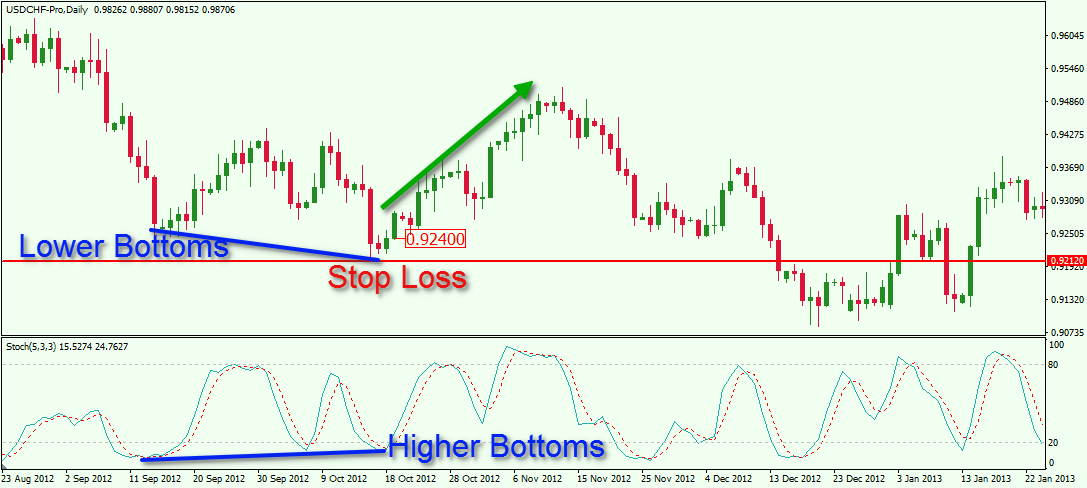
This is the H1 chart of the USD/CHF Forex pair showing a bullish divergence between the Stochastic and the price action. This created an opportunity to enter the market with a long trade at 0.9242 as shown on the image. The stop loss location would be below the swing low, right below the last bottom of the divergence pattern.
After the confirmed bullish divergence, the USD/CHF price starts increasing
Take Profit when Trading Divergence
You should always have strict take profit rules when trading divergence. For all the positives of trading divergences, one of the things that divergence trading does not offer us, are clear targets. Therefore, an additional tool should be used in order to select your profit targets. Typically, If you trade divergence with RSI or Stochastic, you may need an additional indicator to close your trades. However, if you use the MACD, then you could fully rely on this indicator alone. The reason for this is that the MACD is a lagging indicator and it is a good standalone tool for exits as well as entries. My preferred method is to use swing analysis and and support resistance levels for trade management and profit target setting, however, as I have just mentioned, the MACD is also a viable option.
A Complete Forex Divergence Strategy Using the MACD
We have all the tools that we need into order put a Forex divergence trading plan together. Let’s now combine all the rules and see how this would look. We will use the MACD indicator for spotting divergence and for closing trades. When we see discrepancies between price action and MACD, we will enter trades based on a divergence signal. When we see an MACD crossover in the opposite direction, we will close our trades.
Let’s now see how all this works.
This is the same Daily chart of the EUR/USD we used at the beginning of this article. However, this time we have included our entire trading strategy here.
We first start by spotting a bullish divergence between the MACD and the price action. The chart shows lower bottoms, while the bottoms on the MACD are increasing. This is our bullish divergence. Suddenly, after creating its third higher bottom, the MACD lines make a bullish crossover. We could use this signal to go long on our bullish divergence setup as shown with the green horizontal arrow. Our stop loss order should be located right below the last bottom as shown on the image.
The price starts moving upwards. The MACD starts increasing as well. Two months later, the MACD signals a bearish crossover. We use this as an exit signal and we close our trade.
So we have discussed various types of Divergences, the indicators that can be used to trade them and also some trade management techniques that can be employed within a divergence strategy. This should be a good base from which you can create and start testing out a divergence method of your own.
Conclusion
- A divergence setup is a leading Forex pattern, giving us an early entry into emerging price moves.
- Divergence trading is an effective method, and allow traders to combine price action and indicator analysis into a trading strategy
- There are four types of divergence patterns:
- Regular Bullish Divergence
- Regular Bearish Divergence
- Hidden Bullish Divergence
- Hidden Bearish Divergence
- Some reliable indicators for trading Forex divergence are:
- MACD
- RSI
- Stochastic Oscillator
- Momentum and Bollinger Bands
- A sound money management plan is required for trading Forex divergence or any strategy for that matter.
- Divergence Signals do not provide clear Profit Targets. We do not know how far prices are likely to go once they reverse, so in many cases, we have to utilize other techniques to exit our divergence trade setups.
- The MACD is a good standalone tool for trading Forex divergence. When you trade divergence with the MACD, it can be used to provide you with entry and exit signals.