Today we will discuss one of the most important trading tools that every forex trader should be using on a daily basis. This is the Forex economic calendar, which details upcoming economic releases, speeches, interest rate meetings, and much more. In the following material, we will discuss some best practices around using an economic calendar to guide your currency trading.
What is a Forex Economic Calendar?
The Forex economic calendar is an event based calendar that traders use to keep current with upcoming financial information. An FX calendar contains information for future and past economic events of different countries and can clue the trader in on potential volatility expansions of certain currency pairs.
Each currency is representative of the economic, political, and social stability of a country. In this relationship, changes in the economic indicators of a country are likely to affect the value of the respective currency. Since every Forex pair consists two currencies, each pair represents the balance of market sentiment for the two countries that represent the respective currency pair.
For example, The EUR/USD currency pair consists of two currencies – Euro and US Dollar. The Euro is the currency that represents the Euro Zone, and the US Dollar represents the USA. In this scenario, if you are trading the EUR/USD Fx pair, you will be interested in the economic events that come from the Euro Zone and the USA, since they are likely to cause the highest volatility for the EUR/USD. When volatility appears, trends are likely to emerge, providing lucrative trading opportunities for the informed trader.
Important Events on the Forex Calendar
There are many events that are tracked within an economic market calendar. Some of these have a big impact on specific currency instruments, while others are not that important. It is crucial to know which events are likely to cause volatility to expand vs. other events that may have only a minor, if any impact on currency pricing.
Below is a list of some of the most important economic data sets that are released on a currency trading economic calendar.
Jobs Data
- Unemployment Rate
- Unemployment Change
- Employment Change
- Non-Farm Payrolls
- Job Openings
Purchasing Managers Index
- Purchasing Managers Index (PMI)
- Manufacturing PMI
- Construction PMI
- Services PMI
- Non-Manufacturing PMI
Inflation Indicators
- Retail Sales
- Core Retail Sales
- Consumer Confidence
- Consumer Price Index (CPI)
- Producer Price Index (PPI)
- Core CPI
- Inflation Reports
Trade Data
- Imports
- Exports
- Trade Balance
Gross Domestic Product
- Gross Domestic Product (GDP)
- GDP Growth
Monetary Policy
- Interest Rates Decision
- Speeches of Officials
- FOMC Meeting Minutes
- FED Chair Janet Yellen
- ECB President Mario Draghi
- Bank of England Governor Carney
- Bank of Japan Chairman Kuroda
- Bank of Canada Governor Polioz
- Reserve Bank of New Zealand Governor Wheeler
- Reserve Bank of Australia Governor Lowe
- Swiss National Bank Governor Jordan
Above you see the most important FX economic calendar events that need to be followed when trading currencies. Each of these events is likely to bring increased volatility to its specific related currency pairs.
If you are interested in other currency pairs, then you should also look to follow the monetary policies in those countries in the same way as you would do with the countries noted above. For example, if you are trading the Turkish Lira, you should be aware of the monetary policy that is implemented by the Central Bank of the Republic of Turkey (CBRT).
Interpreting the Forex Trading Calendar
Each economic data release includes several data points of concern to traders. When you are looking at an economic announcement calendar, you are likely to see several fields that concern each economic indicator. Let’s take for example the annual Chinese GDP Growth after the 4th quarter of 2016. This is what you will typically see in a Forex trading news calendar related to this event.
Friday, January 20, 2017
| Time (GMT) | Currency | Importance | Event | Actual | Forecast | Previous |
| 02:00 | CNY | High | Chinese GDP (Q4) (YoY) | 6.8% | 6.7% | 6.7% |
On the top, you see the date of the economic event – January 20, 2017, along with the day – Friday. “Time” refers to the exact time of the announcement – 02:00 GMT since we have picked Greenwich Meridian Time as a base for our calendar. Under “Currency” you will find “CNY” – the currency which the event is likely to impact. “Importance” reveals for how significant the event is for the CNY in terms of potential volatility. Then we see the “Event” field.
Notice that it says Chinese GDP (Q4) (YoY). What do (Q4) and (YoY) stand for? (Q4) stands for the 4th quarter of the year. Every financial year is divided into four quarters:
- Q1: January – March
- Q2: April – June
- Q3: July – September
- Q4: October – December
Since the Forex calendar says (Q4), this means that our release concerns the fourth quarter of 2016.
Then we have (YoY). YoY stands for “Year over Year.” This means that we have an annual release, which covers the period of Q1, Q2, Q3, and Q4.
The “Actual” field shows the current release data, which we have been waiting for. “Forecast” refers to the official expectations for the index – a result of the statistical surveys conducted by the Chinese government. “Previous” refers to the last Chinese GDP (Q4) (YoY) data release.
So, according to the data above we can conclude that the Chinese government expected to hold the Gross Domestic Product in the country unchanged at 6.7%. However, it appears that the Chinese GDP was printed at 6.8%, which is 0.1% higher than the reported expectations.
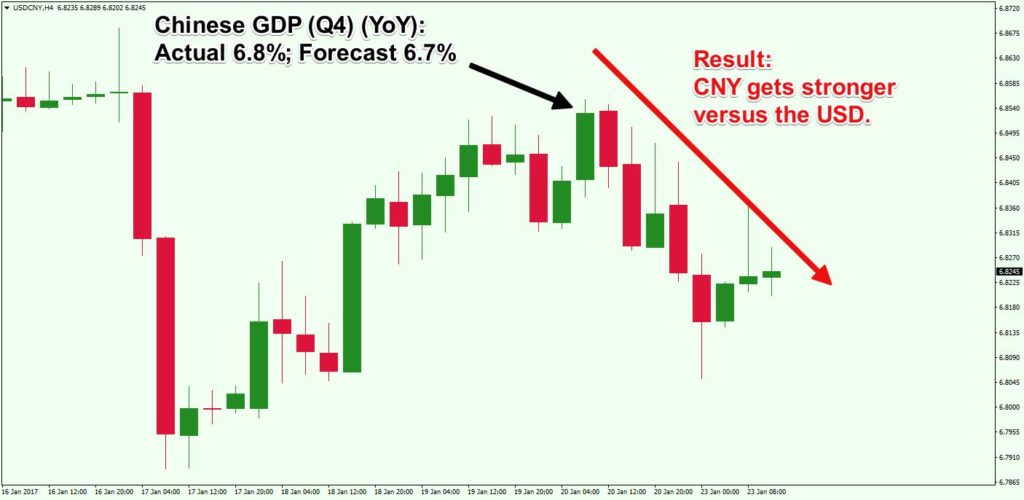
This means that the Chinese GDP data is better than the expectations, which is likely to have a positive impact on the Chinese Yuan. Let’s see how the CNY reacted to the announcement:

Above you see the H4 chart of the USD/CNY Forex pair for Jan 16 – 23, 2017. The black arrow on the image points to the moment when the Chinese GDP (Q4) (YoY) is released. Since the data is better than expected (6.8% actual vs. 6.7% expectations), the Chinese Yuan appreciates versus the US Dollar, which causes the USD/CNY Forex pair to drop – USD drops versus the CNY. As a result, the CNY gains 0.66% versus the USD.
How to Use the Forex News Calendar
Traders use the economic events calendar to follow data releases and to catch price moves like the one we showed in the example above. If you have a data release, which is better than the forecast, then you are likely to see the respective currency pair appreciate versus other currencies.
Therefore, you may consider buying the currency of the country with the better-than-expected data release on the assumption that this currency will increase as a result of the optimistic economic release.
The opposite applies if the release is worse than the expectations. In this case, investors say that the data release is “downbeat,” which is likely to cause depreciation of the related currency versus other currencies. In these cases, you may consider selling the currency that is expected to depreciate.
Timing Trades when Using a FX Calendar
Trade execution time is very important when trading economic news because currencies tend to react almost instantly to the news event. Some data releases, however, are likely to cause a long-term impact as well.
Take for example the interest rate decision in a country. Interest rates are used by central banks as a currency price and inflation regulator. No country wants to see its currency very high (expensive) or very low (cheap). Therefore, central banks can increase and decrease interest rates in their respective countries to stimulate or suppress growth and spending.
If interest rates are high, then loan costs will be high as well. This means that investors will take on fewer loans. This will typically decrease spending, inflation, and currency value in that country.
If interest rates are low, then loans will be cheaper and more attractive to people. This will typically increase spending, inflation, and currency value in the country. Therefore, interest rates have a long-term impact on currency pairs.
Economic News Calendar Example
The two-row table we used above to show you how an economic release might be displayed is just a single event example. Now we will show you what an actual Forex calendar looks like.
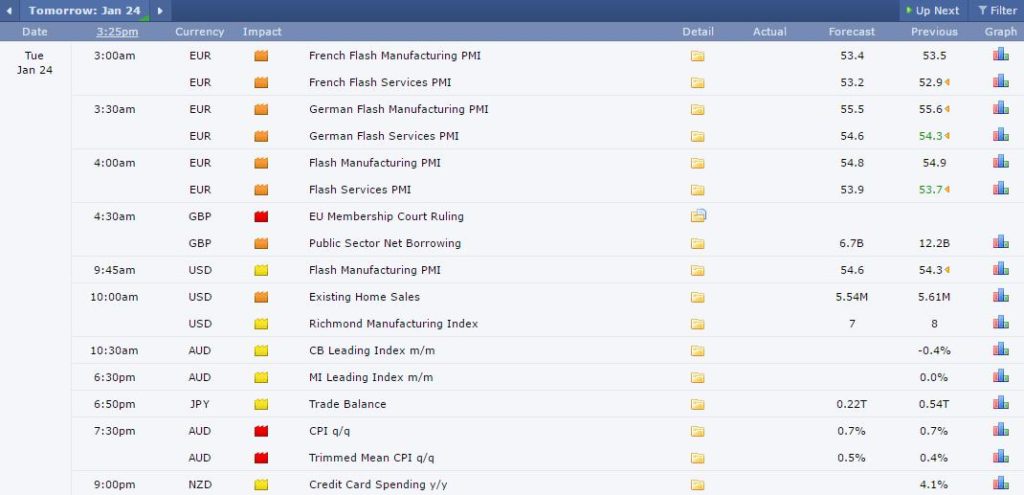
One of the most popular economic calendars online is the Forex Factory economic calendar. Below you will see a sample depiction of the Forex factory calendar:

Notice that this time we have many events listed. The data is structured pretty much the same way as with the example we already gave. However here you have the option to click on the “Graph” of every economic event, which will give you a graphical history of the previous announcements concerning the respective economic indicator. Also, if you click on the “Detail” of the economic indicator, you will get additional information about the upcoming release, including frequency of announcement and the date of the next release expected.
“Impact” stays for the importance of the economic release. Notice that the “Impact” field contains three different colors:
- Yellow – Low Impact
- Orange – Medium Impact
- Red – High Impact
Low, medium, and high are the expected volatility, which the event is likely to bring.
Trading Strategies using the Forex Event Calendar
Now that you are familiar with the Forex economic calendar and you know how to interpret the data inside, I will show you a couple of strategies used by fundamental news traders.
Trading in the Direction of the Release
This is one of the most common news trading strategies. The point is to wait for an event and to trade immediately in the direction of the announcement.
If the event is better than expected, then you buy the respective currency. If the event is worse than expected, you simply sell the currency.
Your stop loss order should be placed on the other side of your entry point, preferably beyond a recent swing. However, you should try to keep your stop a bit loose, since high volatility is expected at the time of the release and shortly thereafter. If the stop is tight, then there is a high likelihood that the price hits your stop loss from the whipsawing price action.
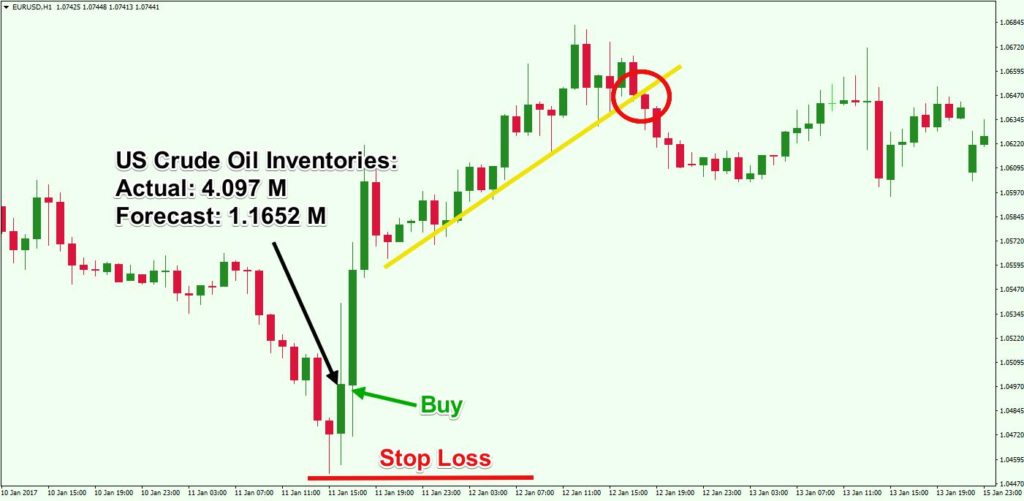
Let’s demonstrate this strategy with an example. On January 11, 2017, the United States announces an excess of Crude Oil, 4.097 million barrels on a forecast of 1.162 million barrels. Furthermore, the previous release of the US Crude Oil inventories stands at, 7.051 million barrels. This means that the US Crude Oil Inventories have accounted for an unexpected drastic increase.
Тhere is an excess of Oil in the US, and the Oil prices are likely to drop due to oversupply. Since a sizable part of the US GDP depends on Oil production, a decrease in Oil prices is likely to cause a decrease in the US Dollar exchange rate.
Therefore, the USD is likely to decrease versus the other main currencies. As such, a news trader evaluating this event could open a long position on the EUR/USD. The fundamental logic behind this trade is that the USD should depreciate, and EUR should appreciate as a result.

Take a look at the EUR/USD chart above which displays the price action at the time of the downbeat US Crude Oil Inventories release. The Euro starts appreciating versus the Dollar. The USD is losing value because of the decrease in Oil prices. Therefore, the EUR/USD pair increases.
When you see the poor US Crude Oil Inventories report in relation to the expected data, you may decide to buy the EUR/USD on the assumption that the pair will likely increase. You can put your stop loss below the most recent swing or support / resistance level, but make sure that you are being liberal with the stop loss placement. As you see the price creates a sharp increase and enters a bullish trend afterward.
To exit the trade you should apply some basic price action rules. In this case, you can hold the trade as long as the price is located above the trend line. If the trendline gets broken, then you can close the trade assuming that the bullish run is likely finished.
Scalping the Release with Two Pending Orders
This strategy suggests you place an OCO order (One cancels the other) prior to the news release. The first part of the OCO order should be a Buy Stop Order and the second part of the OCO order should be a Sell Stop Order.
- Buy Stop Order – buys the Forex pair at a price higher than the current.
- Sell Stop Order – sells the Forex pair at a price lower than the current.
You probably guessed that the purpose of the two pending orders is to trade the currency pair in the direction of the initial volatility expansion – irrespective of what the data comes in at – if the expected data is better than expected our buy side will be triggered, and if the data is worse than expected then our sell side will be triggered. This strategy requires a volatility expansion, if the pair creates a sharp move in either direction, the respective order will be executed automatically. Let’s see how this works:

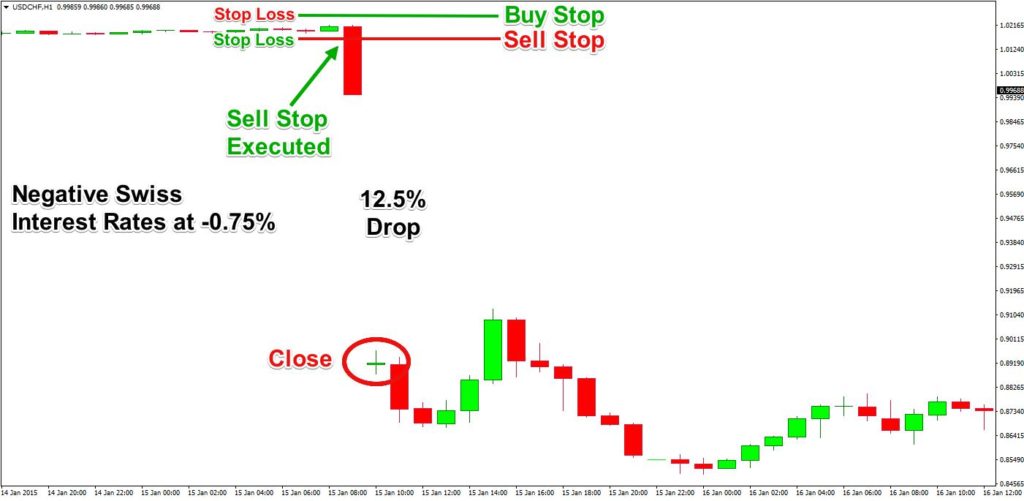
I will give you a historic example of January, 2015 when the Swiss National Bank lifted the minimum exchange rate of 1.20 CHF per Euro. As a result of that, the CHF made incredible increases in its exchange rates. Though this is a somewhat rare occurrence, the mechanics of this strategy remain the same, which is what we are trying to evaluate.
The chart above shows the USD/CHF currency pair at the time of this news event. The two lines at the top of the chart represent the two pending orders which you could have used to bracket the price prior to the upcoming Swiss interest rates release. The stop loss order of the Buy Stop should match the level of the Sell Stop order. Also, the stop loss of the Sell Stop order should match the level of the Buy Stop.
In our case, the rates were released at the extremely low value of -0.75% (negative value), which caused the Swiss Franc to hike versus other major currencies. As a result of this event, the USD/CHF dropped dramatically (USD depreciated vs. the appreciating CHF). This would have triggered the OCO order with the Sell Stop order being filled, putting you in the market with a short trade, and the buy stop order would have been cancelled automatically.
Conclusion
- Economic data released in a country is likely to cause volatility in the currency of the respective country.
- The Forex market calendar is an informative tool that includes past and future economic events.
- Forex traders use economic calendars to track economic data releases and their impact on currencies.
- Some of the most important economic events include the following economic reports:
- Jobs Data
- Purchasing Managers Indices
- Inflation Indicators
- Trade Data
- Gross Domestic Product
- Monetary Policies
- A better than expected economic release is likely to boost the currency of the respective country.
- A worse than expected economic release is likely to depreciate the currency of the respective country.
- Every Forex calendar has several major fields:
- Time – The time in which the economic data will be released.
- Currency – The currency pair the data concerns.
- Importance – How important the event is for the respective currency.
- Event – What the event is.
- Actual (Act.) – The value at which the economic indicator is now being released.
- Expected (Exp.) – The expected value of the release.
- Previous (Prev.) – The previous value at which the indicator was released.
- Two of the most common Forex calendar trading strategies are:
- Trading in the Direction of the Release
- Scalping the Release with Two Pending Orders