 A foreign exchange transaction requires the exchange of one nation’s currency for that of another. As such forex speculators should keep a keen eye on economic activity in multiple countries.
Before getting heavily involved in forex trading, it makes sense to become familiar with the major economies around the world. In doing this fundamental analysis and research, you will learn where to find good sources of economic data for major economies, and begin to understand where they rank by various economic measures relative to other countries.
Using the IMF’s Economic Data for the World’s Major Economies
As a particularly rich source of information for forex traders who wish to incorporate some form of economic analysis into their trading plans, The International Monetary Fund or IMF makes an extensive database of international economic data available to researchers free of charge at its official website.
The IMF typically updates its database in April and then in September or October of each year.
Currency traders can employ this database to obtain information for most of the world’s significant economies regarding: growth, current accounts, employment, inflation, balance of payments, trade balances, fiscal indicators, interest rates, and commodity prices.
The IMF makes its historical data available from as far back as 1980 to the present year. In addition, projections for each data type are provided for the upcoming two years and for even longer for certain key indicators. The IMF, however, warns that its data for some countries may be incomplete.
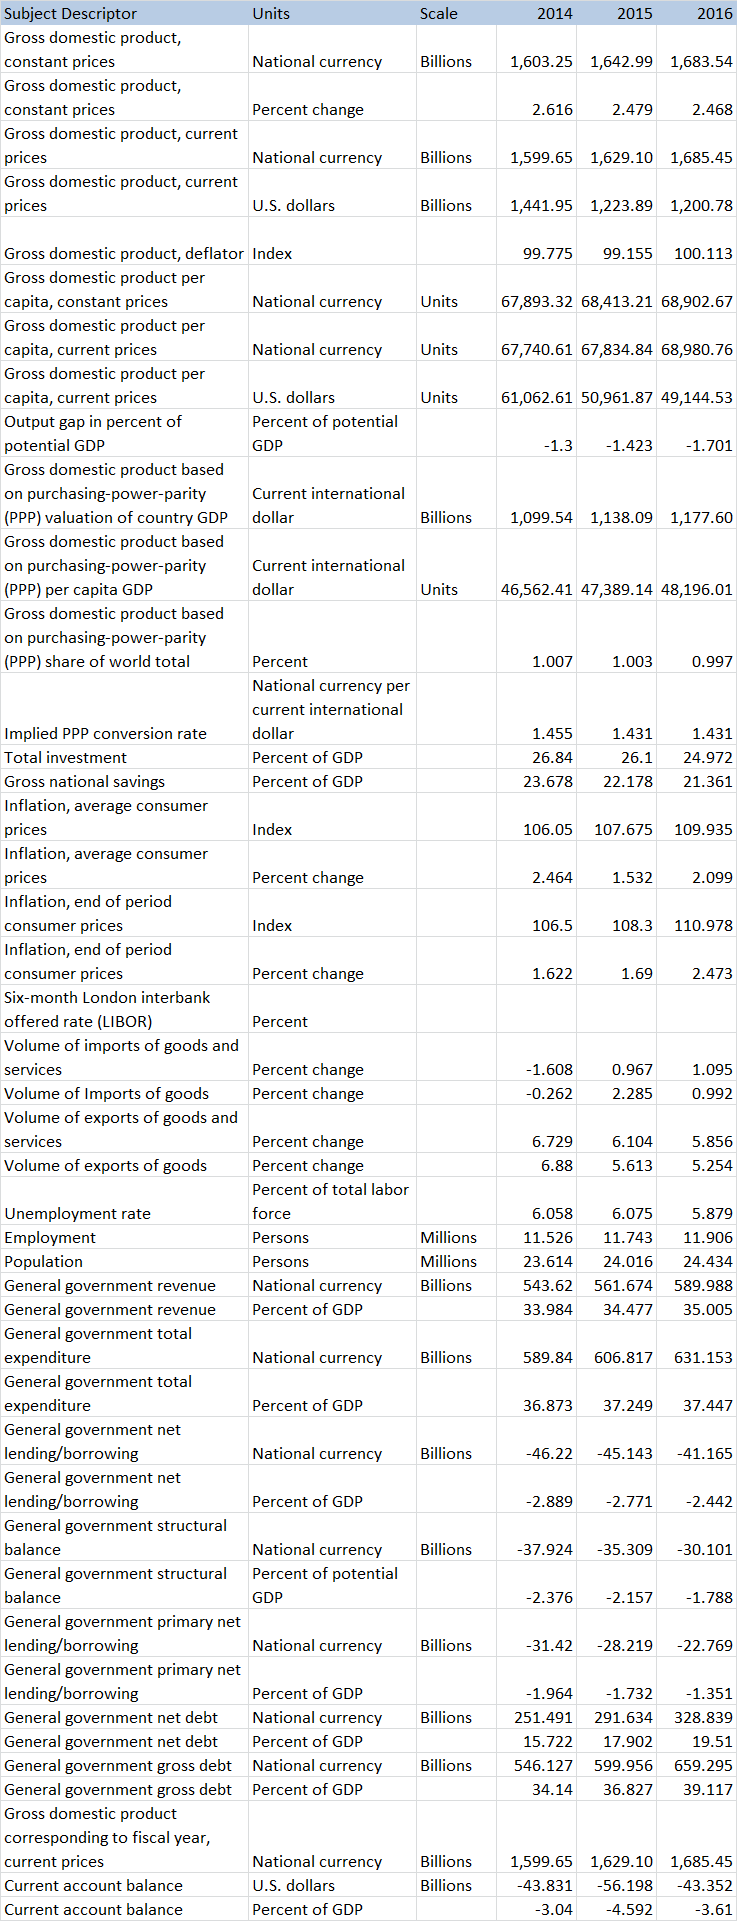
Table #1 below shows the wide range of historical and forecast data that can be obtained using the IMF’s online service. This extensive amount of information can also be easily downloaded into an Excel type spreadsheet for further analysis, reporting and charting.
Table #1: A sample list of the wide range of economic data available for major economies from the IMF’s World Economic Outlook database as of April 2016. In this case, the economic data listed pertains to Australia. The numbers for 2016 are currently estimated and not yet final.
Ranking of World Economies by Growth
The most common standards by which to measure economic size generally involve the use of growth measures. In most cases, either nominal Gross Domestic Product or GDP or Purchasing Power Parity or PPP GDP will be used for economic comparison purposes. Both of these traditional measures of GDP are expressed in monetary terms, and usually the amount will be converted into U.S. Dollars if comparisons are being made between countries or regions.
Nominal GDP represents the final market value of all of the goods and services that are produced by a particular country or region in a specified period. This observation period will typically be quarterly, although some countries report it on a yearly basis.
Estimates of Nominal GDP are often used to assess how a country, region or economic bloc is performing economically, and it is frequently useful when making quantitative comparisons between the economies of countries and regions.
Since Nominal GDP does not reflect the differences observed in the cost of living or in the inflation rate seen in different countries, some analysts prefer to use a GDP measure that incorporates the Purchasing Power Parity or PPP per capita instead.
The PPP GDP measure tends to be a more useful economic yardstick when comparing the living standard differences observed between various countries and geographical regions. Also, by using PPP GDP as an economic ranking measure, this typically tends to increase the rank of less developed countries more relative to the change seen for highly developed countries.
The relationship between a country’s trade and economy is also important to understand. In one study regarding the importance of trade in economics entitled: Trade and Economic Growth: A Re-examination of the Empirical Evidence, researchers Matthias Busse and Jens Königer found that, ”the volume of exports and imports as a share of lagged total GDP” had a “positive and highly significant impact on economic growth”.
Researching Global Economic Growth
Organizations like The World Bank keep track of and forecast the growth of the global economy, as well as the growth rates in a variety of economic aggregate sub-types and regions. The World Bank provides expert forecasts regarding the future growth of the global economy, and the various aggregate sub-types and regions that forex traders can use to predict long term trends in currency pairs.
The aggregates or sub-types for which World Bank data and forecasts are currently available include: advanced economies, high income economies, developing economies, low income economies, emerging market and developing economies or EMDEs, and the BRICS economies that consist of Brazil, Russia, India, China and South Africa.
Furthermore, The World Bank also provides a breakdown on economic growth data and forecasts by region. The regional economies for which World Bank forecasts currently exist include: Europe and Central Asia, Latin American and the Caribbean, the Middle East and North Africa, Sub-Saharan Africa, East Asia and the Pacific, and South Asia.
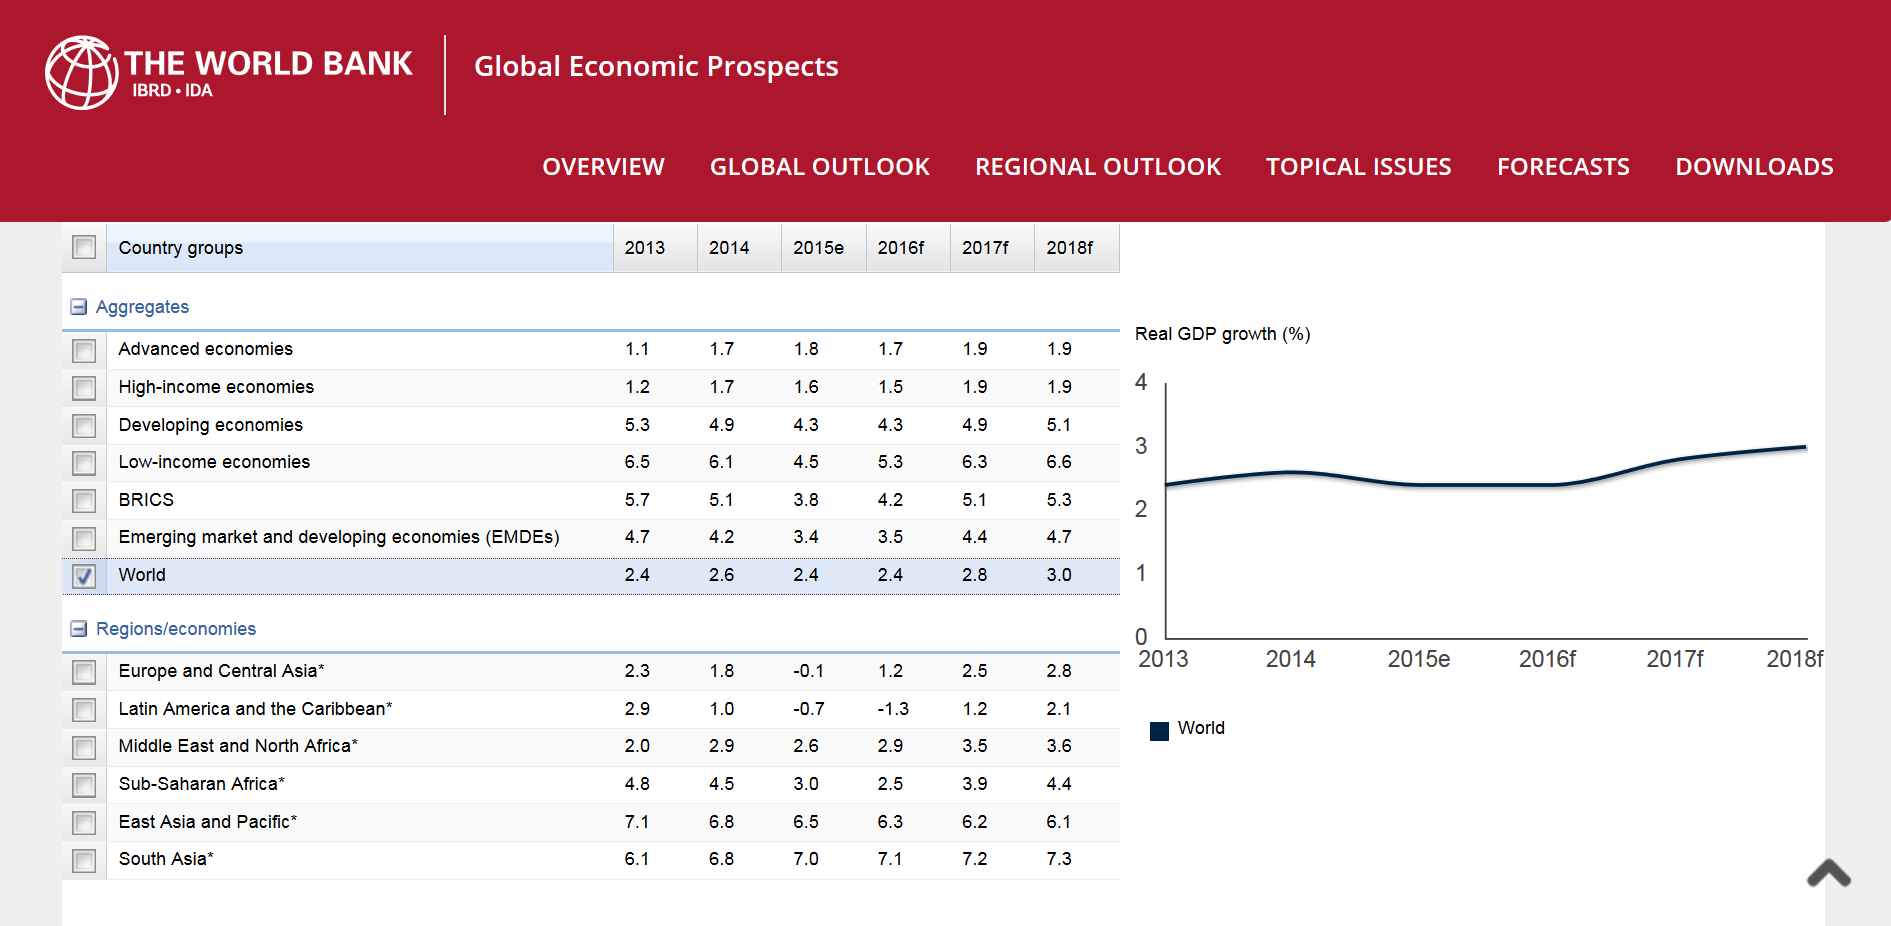
An example of the economic growth data that The World Bank provides forecasts for on their website — in addition to a sample of the charts you can produce using the historical data and forecasts on their website — is depicted in the website screenshot shown below in Figure 1.
Figure 1: Screenshot of The World Bank’s website showing global economic growth prospects forecasted for the world, as well as for various regions and aggregate economic sub-types.
The Top 10 Economies in the World Ranked by Nominal GDP ( as of 2016 )
The world economy has a notably inequitable distribution of income, which can be discerned by the gross domestic products of the top ten major economies. These ten economies’ GDP represents two thirds of the world economy, with the top fifteen economies representing three quarters. The remaining 172 countries make up for only 25 percent of the world’s economy.
The following list ranks each major economy of the world in terms of Nominal GDP. These rankings are based on the World Economic Outlook Database maintained by the International Monetary Fund or IMF published in April 2016.
 Economy #1: The United States – in terms of nominal GDP as measured in current U.S. Dollars, the United States economy ranks as the world’s largest.
The U.S. economy represents a whopping 24.5 percent of the world’s gross domestic product, and many traders watch US economic growth carefully as an indicator of future trends in currency pairs that include the U.S. Dollar.
While the United States is a particularly advanced economy with abundant resources and technology, its number one spot for GDP is relegated to number two after China if measured in PPP or Purchasing Power Parity. China has a GDP of $19.4 trillion compared to the United States’ $17.95 trillion.
Economy #2: China – the Chinese economy has completely transformed from a central planned closed economy in the 1970s to an exporting and manufacturing powerhouse in the present day. The economy in China is equally represented by 45 percent in the manufacturing sector and 45 percent in the services sector. Despite beating the United States in GDP based on PPP, it continues to lag the United States based on a nominal GDP basis.
Economy #3: Japan – the Japanese economy ranks third on the list, however it drops to fourth if measured by purchasing power parity. The economy in Japan has been in recession since 2008 and is still reeling from the effects of a massive earthquake and tsunami that hit the island nation in 2011.
While recent economic growth has been between +0.5 percent and +2.0 percent over the last several years, the $4.12 trillion economy is forecast to grow less than one percent over the next six years.
Economy #4: Germany – fourth on the list is the strongest economy in Europe. The German economy is best known for its exports of vehicles, machinery, chemicals and household equipment. Despite a skilled labor force, the recent influx of immigrants has created a number of demographic challenges to the economies of the entire region.
The size of the German economy in terms of purchasing power parity is $3.84 trillion, while nominal GDP is $3.36 trillion. Germany’s GDP on a per capita basis is $46, 893 with the economy forecast to grow at a pace of one to two percent over the next several years.
 Economy #5: The United Kingdom – at $2.85 trillion, the United Kingdom ranks number five on the list. The bulk of the UK economy is in services, contributing as much as 75 percent of the country’s GDP. Manufacturing follows services as the second most important contributor, while agriculture contributes just one percent.
Despite only contributing one percent to GDP, the agricultural segment produces 60 percent of domestic food needs, while employing only two percent of the country’s workforce. The UK economy is currently in uncertain territory, after the June 2016 referendum that indicated voters’ intention to leave the European Union.
The UK will operate under EU regulations and trade agreements for the next two years, at which time new trade agreements will be drawn up. The results of Brexit have led economists to estimate the economy could see a decline of anywhere from -2.2 percent to -9.5 percent of GDP, depending on how trade agreements will be implemented to replace the current market structure.
Economy #6: France – at $2.42 trillion, France follows the UK as the sixth country on the list. The country’s low rate of poverty and high standard of living can be discerned in PPP GDP per capita of $41,180. France is one of the world’s largest exporters and importers of goods, but it has come under serious pressure over the last few years.
France is currently struggling with high unemployment, with the Unemployment Rate reaching 10.35 percent in 2015. According to the International Monetary Fund, French GDP is expected to increase, while unemployment is expected to decrease over the next six years.
Economy #7: India – on a nominal basis, GDP in India was $2.09 trillion, however, GDP on a purchasing power parity basis of $7.97 trillion puts the Indian economy in third place. Due to the country’s high population, per capita GDP is only $6,162.
The country is still dependent on the agricultural segment with 17 percent of GDP, significantly higher than the more developed economies. The services sector has increased considerably to 57 percent of GDP with industry contributing 26 percent.
India’s favorable demographics and limited dependence on exports, as well as high savings rates and a rising middle class, has led to India overtaking China as the world’s fastest growing economy.
Economy #8: Italy – coming in at number eight on the list, with $1.16 trillion in nominal GDP, Italy continues to be one of the largest economies in the Eurozone. The economy is facing a number of hurdles, including high unemployment and an enormous public debt of 135.8 percent of GDP.
In addition, the country’s banking system is on the verge of collapse. Nevertheless, the country saw positive economic growth in 2015. On a purchasing power parity basis, Italy’s GDP is estimated at $2.17 trillion with a per capita GDP (PPP) of $35,708.
Economy #9: Brazil – the ninth largest economy on a nominal GDP basis ran into serious problems in 2015, falling into recession and dropping from number seven to number nine on the list. The $1.77 trillion economy has services as the sector with the highest level of contribution at 68 percent. Manufacturing contributes 26 percent, while agriculture contributes six percent.
The 2015 recession saw the economy fall into a -3.8 percent negative growth, with prospects for positive growth not forecast by the IMF until 2018. The unemployment rate is expected to reach 10.4 percent over the same time frame. Brazilian GDP on a purchasing power parity basis is $3.19 trillion and GDP per capita (PPP) is $15, 614.
Economy #10: Canada – at $1.55 trillion, Canada overtook Russia — at $1.32 trillion —in the tenth spot on the list. The Canadian economy is mostly services oriented with considerable exposure to commodity and crude oil prices. The recent decline in oil prices has limited the Canadian economy’s growth to only +1.2 percent in 2015 versus +2.5 percent in 2014. GDP on a purchasing power parity basis is $1.6 trillion, while GDP per capita (PPP) is $45,553.
Others Important Economies – several other economies tend to be important for forex traders due to the popularity of their currencies traded in pairs versus the U.S. Dollar and other major currencies. The largest is the European Union’s economic bloc that uses the Euro as its currency and is generally called the Eurozone. Other important economies include those of Switzerland, Australia and New Zealand.