 Volatility is the change in the returns of a currency pair over a specific period, annualized and reported in percentage terms. The larger the number, the greater the price movement over a period of time. There are a number of ways to measure volatility, as well as different types of volatility.
Volatility can be used to measure the fluctuations of a portfolio, or help to determine the price of options on currency pairs. Understanding and learning how to measure volatility in the foreign exchange markets is a must for every serious trader.
Different Types of Volatility
There are two specific types of volatility. What has already happened is known as historical volatility, whereas what market participants think is going to happen is referred to as implied volatility. The former, can be used to predict the latter, but the latter is a market input, determined by the people that are participating in the forex options market.
The market’s estimate of how much a currency pair will fluctuate over a certain period in the future is known as implied volatility. Option traders can use a currency volatility index to price options on currency pairs. Implied volatility is generally considered a measure of sentiment. When the currency markets are complacent, implied volatility is relatively low, but when fear infiltrates the market environment, implied volatility rises.
Implied Volatility is used to Value Currency Options
Implied volatility is a critical component of option valuations. There are two main style of options on currency pairs – a call option and a put option. A call option is the right but not the obligation to purchase a currency pair at a specific exchange rate on or before a certain date. A put option is the right but not the obligation to sell a currency pair at a specific exchange rate on or before a certain date. The exchange rate where the currency pair will be transacted is referred to as the strike price while the date wherein the option matures is called the expiration date.
Forex options are quoted by dealers in the currency markets in two different ways. Dealers at times will quote a number that describes the volatility expected for a specific option that expires on a certain date.
At times they will quote the price of the option. Options on currency futures are always quoted as a price. Options on currency exchange traded funds are also quoted as a price.
The price of a currency option incorporates the market volatility of a currency pair; which is how much market participants believe a market will move on an annualized basis. If you are an active currency options trader you will likely be aware of the implied volatility of each major currency pair. For those that are not actively trading options, there are some tools you can use to find current options implied volatility.
Determining implied volatility for a financial instrument requires certain inputs. The equation is an options pricing model. The most widely used and famous options pricing model is the Black Scholes options pricing model.
Currency Options Pricing
An options pricing model uses several inputs which include the strike price of the option (which is an exchange rate), the expiration date of the option, the current exchange rate, the interest rate of each currency, as well as the implied volatility of the forex option. The calculation determines the probability that the underlying exchange rate will be above or below a strike price, depending on whether you are generating a price for a call or a put option.
All the inputs for the Black Scholes Pricing model are related to one another and therefore if you know the price of the option, you can back out the implied volatility of the forex option. So, if you see the price of an option (or the bid offer spread of an option), you can use an options pricing model to find the implied volatility of the currency pair.
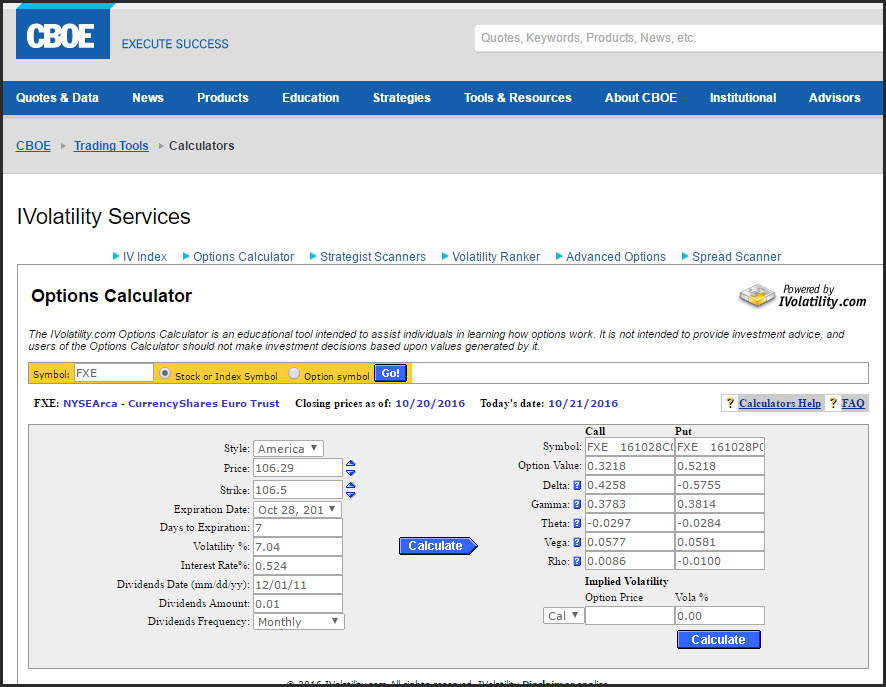
A simple options calculator will allow you to input a price and find the fx option volatility of a specific currency instrument.
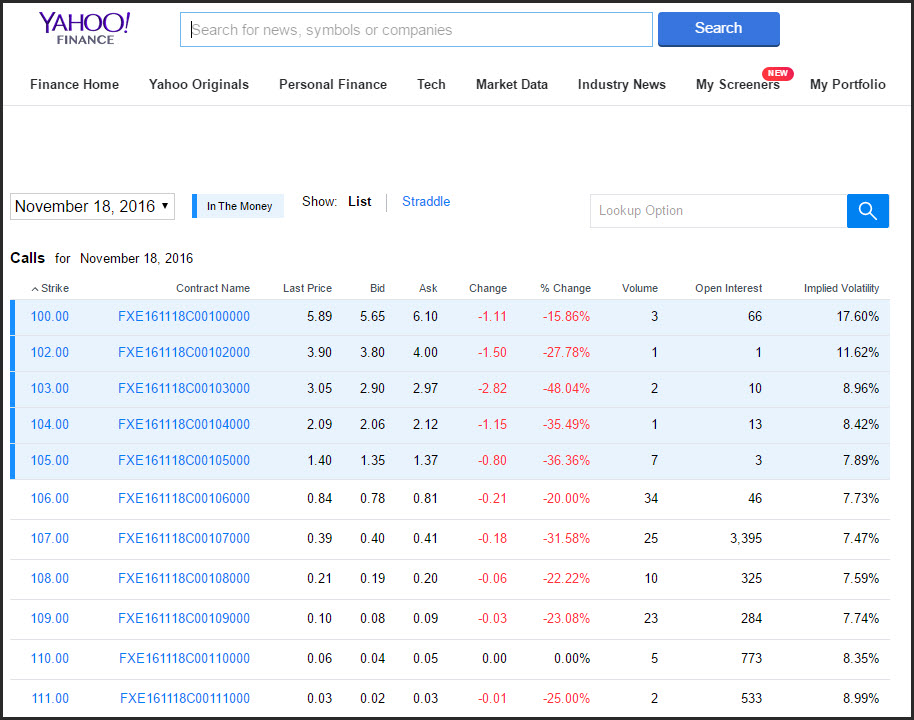
Another simple way to get the volatility of a Currency ETF is to use Yahoo Finance. The options chain example above shows a one-month option price that is closest to the money ($106), has implied volatility of 7.73%. This is a way of estimating what options traders believe will be the movement of the FXE (Currencyshares Euro Trust) over the course of the coming year.
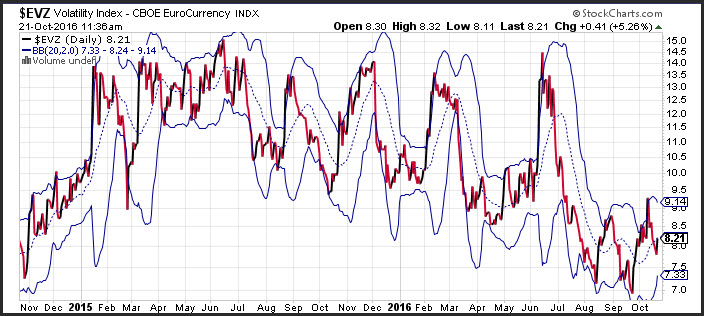
Once you know where current implied volatility is, it is helpful to understand where it was in the past. There are some free versions of software that will show you historical volatility. Ivolatility.com, offers a forex volatility chart which can help you determine the relative level of implied volatility. The free version shows currency ETF implied fx volatility index for 52-weeks, and is helpful in determining the relatively strength of present implied volatility.
There are a few software packages available that will allow you to view long term historical volatility on currency futures as well as currency ETFs. This type of software will allow you to perform many different types of technical analysis studies on historical volatility. Since implied volatility is generally a mean reverting process, you can use different technical studies that measure this – such as the Bollinger bands indicator.
Technical Methods for Measuring Volatility
The Bollinger bands indicator show a 2-standard deviation band above and below the 20-day moving average. These defaults can be changed, depending on how wide you believe the distribution should be. So you can use a 3-standard deviation on a 50-day moving average if you prefer.
When the implied volatility index hits the Bollinger band high which is 2-standard deviations above the 20-day moving average, implied volatility could be considered rich, and when the implied volatility hits the Bollinger band low (2-standard deviations below the 20-day moving average), the level is considered cheap. This type of analysis helps the forex trader implement volatility based strategies.
Additionally, you can use Bollinger bands to evaluate the volatility of any security. The difference of the change in the Bollinger bands (change in standard deviations) is a measure of historical volatility. The Bollinger band width is a measure of the difference between the Bollinger band high minus the Bollinger band low. As the Bollinger band width expands, historical volatility is rising and when the Bollinger band width contracts historical volatility is falling.
Understanding Historical Volatility
In addition to evaluating implied volatility to determine how volatile the market could be, you can also evaluate what has happened in the past to determine future volatility. This is known as historical volatility. Historical volatility tells us how much the market has moved on an annualized basis. The historical volatility is calculated by defining several parameters.
First, you need to decide on the period which for you are calculating the change in price. Historical volatility is calculated by analyzing the returns; which is the change in the value of a currency pair. The basic period can be a one-day change, which is often used, or a 1- week or 1-month change. You will also need to determine how many periods you plan on using in the calculation.
This process can be easily accomplished with excel or by using a calculator. What you are actually trying to calculate is the standard deviation, which is the average squared deviation from the mean. The last thing you need to do is annualize the number by multiplying the volatility by the square root of time which is the days in a year. The output number is a percent value which tells you the annualized movement of the returns of a currency pair.
You can use different technical analysis tools to help you gauge historical volatility. There are many times that current implied volatility is higher or lower than historical volatility. Remember that historical volatility represents the past, and implied volatility represents what traders believe will be the future.
Another statistical indicator that is widely used to measure historical volatility is the Average True Range (ATR) indicator developed by J. Welles Wilder. This indicator was developed to measure the actual movements of a security for implementing trading strategies around volatility. The average true range differs from a standard range formula as it incorporates gaps in price action.
The technique used by Wilder was to incorporate absolute values which guarantees positive numbers. The key is to measure the distance between two points regardless of the direction.
So why would you want to know the historical volatility of a currency pair? One important reason is it can help you manage your risk. Most traders do not sufficiently consider the risks of trading. However, the serious trader understands and incorporates volatility into their trading plan.
Whether you are managing one currency pair or a basket of currency pairs it is helpful to understand the overall risks of your portfolio. Value at Risk (VAR), is a way of describing the risk within a portfolio of currency pairs. The process of analyzing the returns of multiple currency pairs is essential in determining the capital you have at risk.
If you have ever had a situation wherein you have multiple currency positions open at any one time, your risk is very different than having a position open in just one currency pair. What you are attempting to define with VAR is the amount of funds you would lose or gain with a specific movement of your portfolio.
Measuring Risk with Value at Risk (VAR)
Value at Risk can be determined using a few basic methodologies. You can use an analytic solution which uses historical volatility to determine the variances in a portfolio. A second measure is to use simulations.
This means that you look at all the historical paths that were taken over time and simulate the most probable scenario. The more data you have the more likely you will be able to find a solution that is pertinent. Monte Carlo simulation is a popular method for sampling of values in a data series.
Of course there are drawbacks to using VAR as the only strategy to measure market risk. First, there are many assumptions that one can use to define a VAR, which means there is no standard measure. Liquidity plays a role in defining your ability to use VAR as a risk management tool.
If you are running a portfolio of currency majors, your liquidity will be different compared to running an emerging market portfolio. One of the assumptions with VAR is that you will be able to exit with specific parameters. VAR works well with assets that are normally distributed and will not see outside movements caused by political unrest or currency manipulation.
VAR also has a relatively narrow definition and does not incorporate other types of risk management challenges such a credit risk, and liquidity risk. The calculation is purely focused on market risk and could provide a false sense of security if used as a standalone measure.
Additionally, VAR shows a trader the greatest adverse effect of a market move on a portfolio. With currency pairs, there are up and down moves which need to be taken into account when measuring the risk of a portfolio.
There are a number of reasons you would want to know the most volatile currency pairs. The first is to determine the risk you are assuming. It is important to know whether an asset has moved 100% in the last year or 10%. Understanding the risk of a currency pair or a basket of currency pairs is imperative to a successful trading strategy. Having a robust entry signal is only helpful if you have a sound risk management strategy.
Closing Thoughts and Some Additional Considerations
Implied volatility will provide you with the markets estimate of how much the market will move. Historical volatility is the actual volatility that occurred in the past. Generally, implied volatility is higher than historical volatility.
The volatility for the majors in the currency market are relatively subdued relatively to individual stocks or commodities. Rarely does implied volatility for major currencies move above 15%, but this is quite common for individual stocks. The volatility on the S&P 500 index averages around 14%, and has seen spikes as high at 48%. And individual stocks can experience much higher volatility than the Index.
Implied volatility for currency crosses will generally be higher than the implied volatility of the majors. The most volatile forex pairs are exotic currency pairs which can have volatility numbers that are as extreme as some individual stocks.
Implied volatility can also help you measure sentiment. Traders will associate high level of implied volatility with fear and low levels of implied volatility with complacency. Market extremes usually occur when sentiment is at its highest or lowest levels. With this knowledge you can measure the markets pulse by gauging sentiment using implied volatility levels.
By graphing implied and historical volatility, you have a way of measuring perceived future sentiment as well as actual historical sentiment. This can allow you to see how the markets reacted after an event or before an event occurred. You can use a number of technical indicators to help gauge where volatility might be going in the future. By incorporating volatility into your trading plan, you can enhance your return and fine tune your risk management techniques.