If you have been around the Forex market for any length of time, then you definitely have heard about chart patterns and their importance in technical analysis. If you want to learn more about chart patterns and their corresponding signals in trading, then this article will provide you a starting point from which to increase your knowledge of classical chart pattern trading. Today we will go through the most important chart figures in Forex and we will discuss their potential.
What Are Forex Chart Patterns?
Forex chart patterns are on-chart price action patterns that have a higher than average probability of follow-through in a particular direction. These trading patterns offer significant clues to price action traders that use technical chart analysis in their Forex trading decision process. Each chart pattern has the potential to push the price toward a new move. Thus, Forex traders tend to identify chart patterns in order to take advantage of upcoming price swings
Type of Chart Patterns
Forex trading patterns are divided in groups based on the potential price direction of the pattern. There are three main types of chart patterns classified in Forex technical charting.
Continuation Chart Patterns
The trend continuation chart pattern appears when the price is trending. If you spot a continuation chart pattern during a trend, this means the price is correcting. In this manner, continuation patterns indicate that a new move in the same direction is likely to occur. Some of the most popular continuation chart formations are: pennants, rectangles and corrective wedges.
Reversal Chart Patterns
The trend reversal chart patterns appear at the end of a trend. If you see a reversal chart formation when the price is trending, in most of the cases the price move will reverse with the confirmation of the formation.
In other words, reversal chart patterns indicate that the current trend is about to end and a new contrary move is on its way! The most popular reversal chart patterns are: double (or triple) top/bottom, head and shoulders, reversal wedges, ascending/ descending triangle.
Neutral Chart Patterns
These are the chart formations which are likely to push the price toward a new move, but the direction is unknown. Neutral chart patterns may appear during trends or non-trending periods. You may wonder what value there may be in neutral chart formations, since we are unable to know the likely direction.
But actually, spotting a neutral chart pattern is still quite valuable as you can still trade an upcoming move. When the price confirms a neutral chart pattern, you can open a position in the direction of the breakout!
Continuation Chart Patterns
-
Pennant Chart Pattern
The pennant is a corrective/consolidating price move, which appears during trends. It resembles a symmetrical triangle by shape, as both are bound by trendline support and resistance lines. The difference is that pennants typically occur during a trend phase, while triangles can be formed during both trends and general consolidation periods.
Pennants could be bearish or bullish depending on the trend direction. When a pennant occurs during a trend, it has the potential to push the price in the direction of the overall trend. The expected move is usually a measured move, meaning the target from the breakout point equals the size of the pennant itself. Below is an illustration of Pennants:
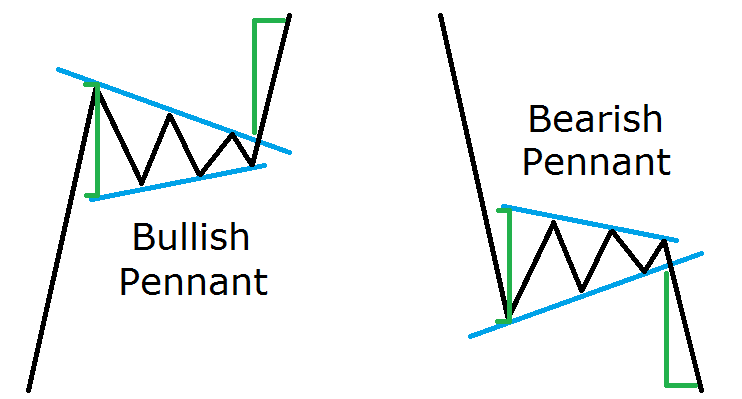
The green lines indicate the size of the pennant and measures the expected price move, which equals the size of the pennant.
When you trade a pennant you should open your position whenever the price closes a candle beyond the pennant, indicating confirmation of the formation. At the same time, your stop loss should be placed right beyond the opposite level of the pennant.
-
Rectangle Chart Pattern
The rectangle chart pattern is a trend continuation formation, which resembles price consolidation within horizontal support and resistance levels. During a trend, when the price starts moving sideways forming a rectangle, another trending move is likely to occur once price eventually breaks out of the rectangle formation. This move is likely to be at least as big as the size of the rectangle. Rectangles could be bearish or bullish depending on the trend direction. Take a look at the illustrations below for the Rectangle formations:
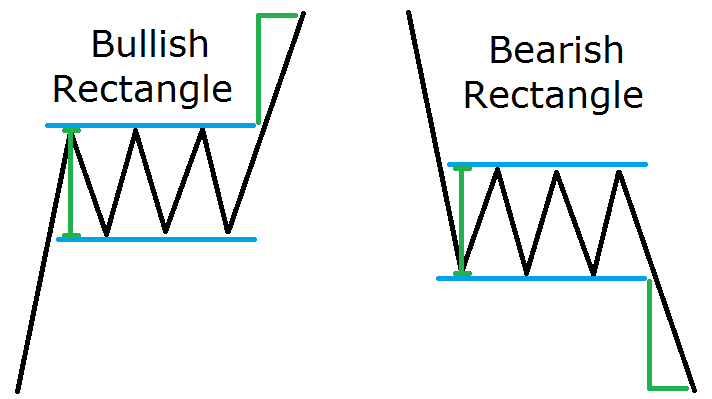
When you trade rectangles, you should put a stop loss beyond the opposite extreme of the formation. Notice that this trading pattern is similar to the pennant, the difference is the swings of the rectangle formation occur within the same price zone.
-
Corrective Wedge Pattern
We have a rising wedge when the price closes with higher tops and even higher bottoms. We have a falling wedge when the price closes with lower bottoms and even lower tops. Wedges are very interesting chart patterns. The reason is that wedges could be a trend continuation or trend reversal formation.
Thus, I decided to distinguish the two types of wedges in order to provide a more detailed classification – So wedges are of two types: corrective wedges and reversal wedges. There is no difference in overall apperance between these two types of wedges. They look absolutely the same – for example, a regular rising wedge and a regular falling wedge. The corrective/reversal character is determined by the previous price movement.
The corrective wedges form as a retracement opposite to the trend direction. In this manner, if you have an uptrend and a falling wedge, you have a corrective falling wedge, which has trend continuation character. If you have a downtrend and a rising wedge, you have a corrective rising wedge, which has trend continuation character. If a corrective wedge occurs during a trend, it has the potential to push the price toward another trending move equal to the size of the wedge itself. This is how corrective wedges appear:
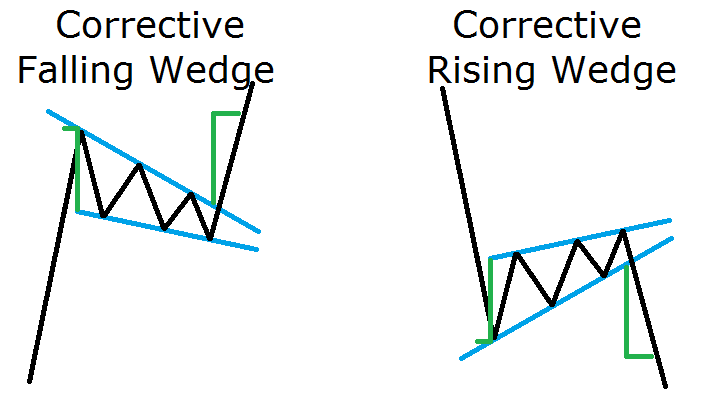
When you trade corrective wedges your stop loss should be placed right beyond the side, which is opposite to the breakout.
Reversal Chart Patterns
-
Reversal Wedge Pattern
I will start with the reversal wedges because the previous chart patterns we discussed were the corrective wedges. This way you will see the difference between these two.
Reversal rising/falling wedges look absolutely the same way as corrective rising/falling wedges. The difference, though, is the relation between the wedge and the trend direction.
Every rising wedge has bearish character. This means a rising wedge reverses bullish trends and continues bearish trends. At the same time, every falling wedge has bullish character. So, falling wedges reverse bearish trends and continue bullish trends. Still not getting it? Have a look at the image below:
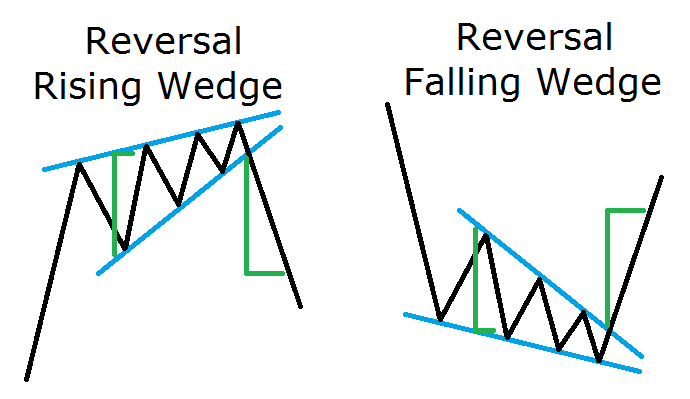
You see? The reversal wedges are absolutely the same as the corrective wedges in appearance. The difference is where they appear in relation to the trend. When a reversal wedge occurs at the end of a trend, it has the potential to push the price to an opposite movement equal to the wedge itself. When you trade reversal wedges you should place your stop loss order right beyond the level, which is opposite to the wedge breakout.
-
Double Top and Double Bottom Patterns / Triple Top and Triple Bottom Patterns
These are another example of reversal chart patterns. We have a double top pattern when after an uptrend the price creates two tops approximately on the same level. And on the contrary, we have a double bottom pattern when after a downtrend the price creates two bottoms approximately on the same level. It is absolutely the same with the triple top and triple bottom formations. The difference, though, is that the tops and bottoms here are three and not two. This is how these formations look:
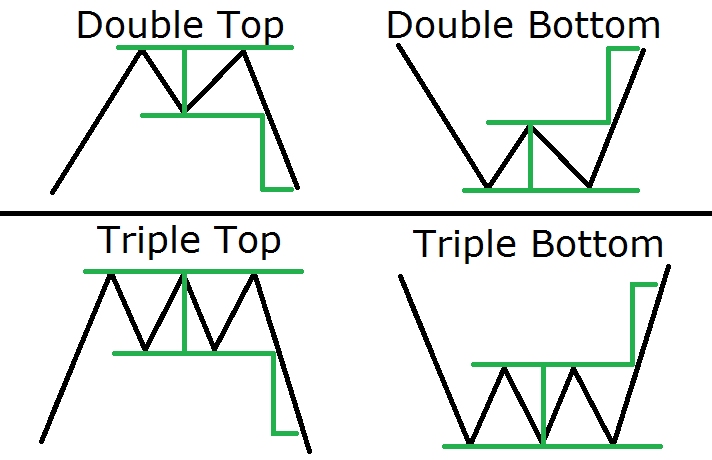
The green lines here indicate the size of the formation and its respective potential. We determine the size when we take the highest top and the lowest bottom of the formation. When we confirm the authenticity of these trading patterns, we expect a price move equal to the size of the formation. This is typically referred to as a 1 to 1 measured move.
But how do we confirm the formation? When we trade double and triple tops and bottoms we need to settle on the signal line for the formation. The signal line of the double top is the horizontal line which goes through the bottom between the two tops. The signal line of the double bottom is the horizontal line, which goes through the top located between the two bottoms.
With the triple tops and bottoms it’s almost the same. This time, the signal line goes through the lowest bottom for a triple top formation and through the highest top in case of a triple bottom formation. When the price closes a candle beyond the signal line, we have a pattern confirmation. Then you can open a position and place a stop loss around half the size of the formation or at the pattern extreme.
-
Head and Shoulders Pattern
This is one of the most reliable chart patterns in the technical analyst’s arsenal. Head and shoulders are a reversal formation and indicate a topping reversal after a bullish trend.
At the same time, this chart pattern has its opposite equivalent – inverted (or inverse) head and shoulders. The inverted head and shoulders typically appears after a bearish trend and calls for a bottom in price. Below you will find illustrations of this pattern:
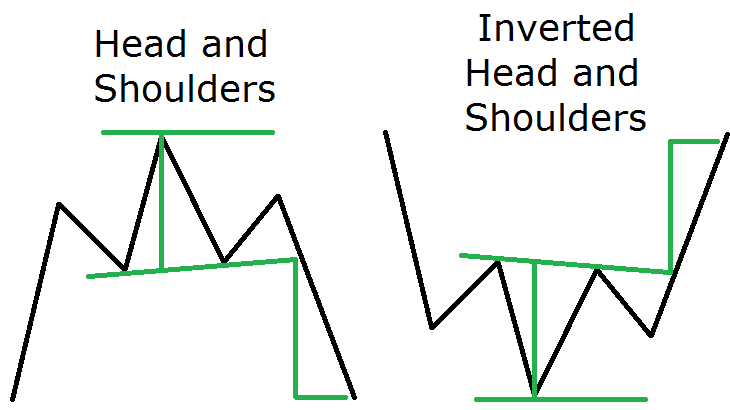
As you see, the head and shoulders formation really looks like a head with two shoulders. After an uptrend, the price creates a top, then it corrects. It creates a second, higher top afterwards and then it drops creating a third, lower top – head and shoulder.
It is the same with the inverted head and shoulders but instead of an uptrend we have a downtrend and instead of tops the price creates bottoms, as shown on the image above.
The bottoms forming the head are two points which create the signal line of the formation. This signal line is called a Neck Line. When the price closes a candle beyond the neck line, the head and shoulder formation is confirmed and we can enter the market with the respective position. This position should be short in case of head and shoulders and long in case of inverted head and shoulders. Your stop loss should be placed right above the last shoulder of the formation.
-
Ascending Triangle Pattern / Descending Triangle Pattern
The ascending triangle has tops, which lay on the same horizontal line and has higher swing bottoms. The descending triangle has bottoms, which lay on the same horizontal line and lower swing tops.
Although many people consider these chart patterns as neutral, their chance to reverse the trend is a bit higher. Thus, I put them with the trend reversal chart patterns. This is how the ascending and the descending triangles look:
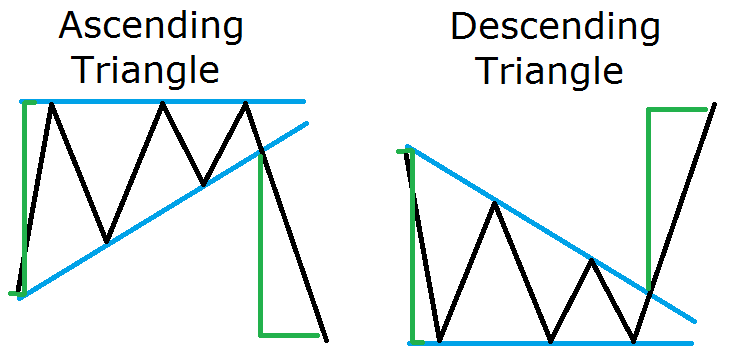
As you see, ascending and descending triangles are very similar to the rising and falling wedges. The difference is that rising wedges have higher tops and falling wedges have lower bottoms, while ascending triangles have horizontal tops and descending triangles have horizontal bottoms.
When an ascending/descending triangle is confirmed, we expect a reversal price movement equal to the size of the formation.
This is shown with the green lines on the image above. The stop loss should be placed right beyond the horizontal level of the triangle.
Neutral Chart Pattern – Symmetrical Triangle
Symmetrical triangles have two sides, which are approximately the same size. Since the two sides of the triangle are usually the same, this creates a technical force equivalency, which creates the neutral character of the formation. The image below shows how a symmetrical triangle appears:
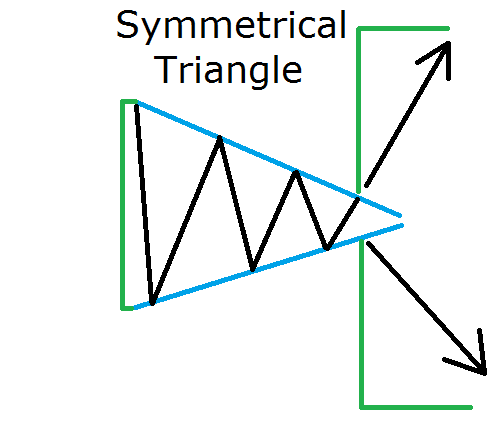
When a symmetrical triangle occurs on the chart, we expect the price to move in an amount equal to the size of the formation. However, the direction of the breakout is typically unknown due to the equivalency of the two sides of the triangle. Thus, price action traders tend to wait for the breakout in order to confirm the potential trade direction of the formation. If you trade a symmetrical triangle, you should place a stop loss right beyond the opposite end of the breakout side.
Trading Chart Patterns
Now that I introduced you to the most important patterns for chart reading it is now time to show you an example of the chart patterns in action. Have a look at the image below:
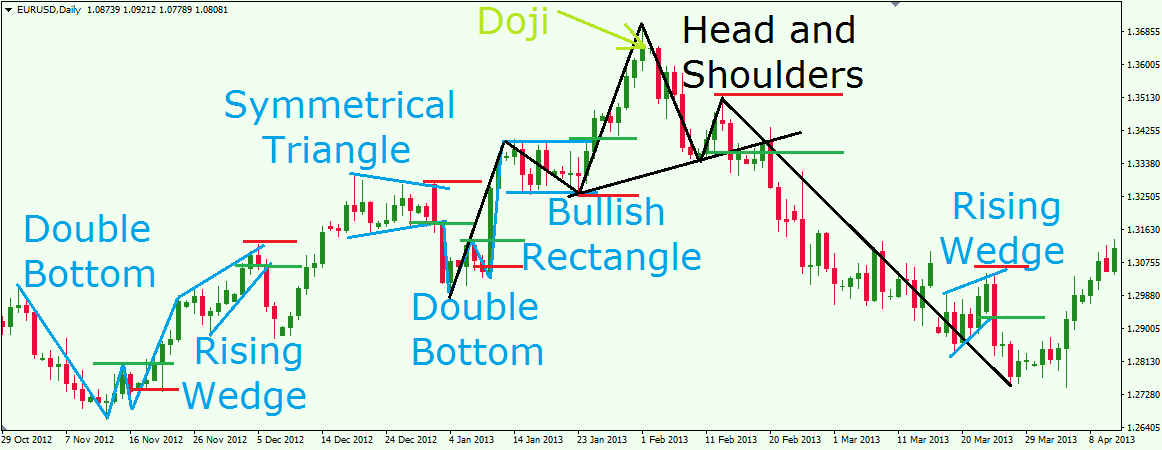
This is the daily chart of EUR/USD for Oct 29, 2012 – Apr 12, 2013. Our chart analysis shows seven successful chart patterns. The green lines show where we could open our positions. The red lines show where stop losses should be placed.
First, we start with a double bottom formation. The green line is the signal line of the figure and the moment where we would go long. The red line is the stop loss, which is approximately in the middle of the formation. The EUR/USD price increases to 187 pips in 5 days.
The price increase turns into a rising wedge afterwards. Since the wedge comes after a price increase, it has a reversal character. The lower level of the wedge gets broken in bearish direction and would be a potential short on the EUR/USD. The could be closed after two days when the price reached the size of the formation. The profit gain would have been 190 pips.
Then the price starts a new increase which leads us to a symmetrical triangle. Look how the sides are approximately the same size and under the same angle. Since the symmetrical triangle has neutral character, we wait for a breakout. And here it is in bearish direction. We could have shorted the EUR/USD and placed the stop loss right above the figure. In the same day the price completes the size of the formation – 137 pips that same day.
The decrease after the symmetrical triangle leads us to the first bottom of a double bottom formation. When we spot the second bottom, we would put the signal line right above the top between the two bottoms. The price breaks the signal line and a long trade is confirmed. We would place the stop loss around the middle of the figure. In this particular case, one could have stayed in the market for twice the size of the formation!
Soon afterwards, price starts consolidating. Notice how the consolidation resembles a rectangle? Indeed! This is a bullish rectangle! The price breaks the upper level of the rectangle and a buy setup occurs in this EUR/USD Forex pair. We could manage to stay with this long position more than the potential of the rectangle, because we get no bearish behavior after the bullish potential is fulfilled. The price starts hesitating afterwards and we see some bearish attitude on a lower time frame chart (H4). Furthermore, on our daily chart the price closes a Doji candle which has a potential reversal character.
Suddenly, the price finally starts to drop. Do you see something? See the black lines on the image above. The last double bottom followed by the bullish rectangle creates a shoulder and a head. The following decrease creates a second shoulder afterwards. This is a nice head and shoulders formation. In order to confirm the setup, we need price to break and close beyond the neck line of the formation. So, we connect the two bottoms which create the head and we get our neck line. A shorting opportunity in the EUR/USD occurs right after the price breaks the neck line. We could sell the EUR/USD and put a stop loss right above the last shoulder of the figure as shown on the image. We would want to stay with the short position until the price completes the size of the figure.
Then a corrective rising wedge appears. It is up to you if you are going to close the head and shoulders position and then open another short position to trade the rising wedge. The other option is to stay with the head and shoulders short position until the wedge is completed. In both cases you would have generated solid profit from the head and shoulders pattern.
Conclusion
- Forex chart patterns are technical on-chart patterns which clue us in on eventual price moves.
- Chart patterns are classified within three types:
- Continuation Chart Patterns
- Reversal Chart Patterns
- Neutral Chart Patterns
- Some of the most important trend continuation chart patterns are:
- Pennants
- Rectangles
- Corrective Wedges
- Some of the most important trend reversal chart patterns are:
- Double/Triple Top/Bottom
- Head and Shoulders
- Reversal Wedges
- Ascending/Descending Triangles
- One of the most popular neutral chart pattern is the Symmetrical Triangle
- All these chart patterns have a tendency for a price move equal to the size of the formation itself. This is referred to as a measured move price potential.