FX markets often experience sharp moves on the back of news or data releases. This extra boost in volatility can give traders many opportunities to place short term trades. High impact news trading can be very rewarding or very painful. The extra volatility that comes with the latest forex news needs to be understood and approached in the right way.
A basic understanding is necessary, of the macroeconomic factors that underlay the forex market news and data releases. Other high impact FX news also comes at central bank meetings, when the head of the institution gives a press conference. The minutes immediately after their announcements can create extreme price swings. It is an absolute must to be able to interpret the news in these moments with the help of some good forex news sites.
We are going to look at the main factors driving price action that come from data releases, how to set up trades in and around news events, as well as where to get the information for economic calendars and more importantly expectations.
When I mention expectations, what we are looking at is the market expectations for any given event. The market has already priced in the expected release or event. If there is a large deviation from the expectation then we can expect a considerable price move.
Macroeconomics in Forex News Analysis
The main economic factors that drive FX market news are inflation, GDP and employment data. Then, there are secondary ones, such as retail sales or money mass, these tend to have less effect on the markets.
We will concentrate on the main ones as they are more likely to have a greater impact on price action compared to other forex news.
Non-farm Payrolls
One of the most anticipated events for the FX industry news is Non-farm Payrolls from the USA. This data release is watched by traders and investors globally across all markets from FX to stocks and bonds.
It is released once a month on the first Friday of each month. This is the event everyone watches for forex news trading, as it can be one of the most lucrative currency market news events.
The reason this data moves markets across the global investment spectrum is that it is the number one indicator for the rate of economic growth. As the US has the largest economy in the world anything that happens there will naturally have an effect on the markets of other countries.
In terms of USD forex news this is the most important news event, as this currency is quoted in all major currency pairs and most other currencies are quoted against the US dollar also. The size of the US economy together with it being a reserve currency means that it effects FX markets across the board. Often the actual number released for Non-farm Payrolls deviates from the expected figure, so we often see increased bouts of volatility after the release.
What effect does a larger or lower Non-farm Payrolls number have on FX markets?
A larger number for Non-farm Payrolls means the US economy is performing better, that is to say it is positive for the US dollar. A smaller number denotes weakness in the US economy and is bad for the currency.
More importantly, we need to know when the economy is expanding or contracting rather than just doing better or worse. Whether the Non-farm Payrolls number is indicating an expanding or contracting economy is linked to what is seen as the minimum number of job creation to cater for new job applicants. Before the Covid pandemic that number was around 140k. Generally speaking a higher number than 140K would have denoted an expanding economy. A number below 140K would have indicated the economy is contracting.
Inflation & Interest Rates
Inflation also acts as a measure of economic growth. An expanding economy creates pressure on the demand for goods and supplies, increasing their price. Higher inflation typically goes hand in hand with an expanding economy. Central banks usually have among their mandates that of stabilizing inflation.
They are also concerned with economic growth. If inflation is weak so too is economic growth. Central banks also watch inflation figures to determine their monetary policy. If inflation is lower than their target rate, often around 2% in developed economies, they will probably implement an expansive monetary policy.
There are various tools Central banks can use. One is lowering interest rates; this helps spur the economy as finance is cheaper for companies and consumers. Lower interest rates, however, make a currency less attractive. It may also create expectations of a cut in interest rates in the near future, which is also bearish for a currency.
An increase in inflation figures makes a currency more attractive, as it increases the chance of central bank action to raise interest rates. An increase in inflation means the economy is improving and a better performing economy makes a currency more attractive.
The market looks at inflation figures to try and assess the likelihood of a central bank taking action at its next monetary policy meeting. Again, the expected figure for inflation is already priced into the market. What traders are looking for is a significantly large enough deviation from that expectation.
Various types of inflation figures are released throughout the month. In the USA the main data to follow is the Consumer Price Index. This data is released once a month around the middle of the month.
GDP and Economic Expansion
GDP Growth is the measure of economic performance. Although it is backward looking it can generate a view of what is to come. Most importantly it is an indication of what we can expect for the future in terms of jobs and inflation if a particular GDP Growth rate continues over the months. Strong GDP data is positive for a currency while the reverse is true for a weak number.
For the US dollar, GDP data is issued monthly towards the end of each month. However, we also have other data releases that are of importance: ISM Manufacturing PMI, ISM Services PMI, and Durable Goods. The ISM (Institute for Supply Management) releases two sets of data for the manufacturing and services industries.
Both data are released at the beginning of each month. They are considered good indicators of the overall economic health of the USA and are closely watched. A number above 50 in either of these two denotes an expanding economy, while a number below implies a contracting economy.
Durable Goods Orders, is also closely followed as it is considered a good reflection of current and future economic activity. This data measures the cost of goods received by manufacturers that are expected to last three years or more, such as automobiles or electrical appliances. This figure is published by the US Census Bureau around the same time as GDP. A number above zero indicates expansive economic activity, while a number below zero indicates economic contraction.
Market Expectations
In fundamental analysis you can follow the trend of the economic expansion by monitoring employment, inflation and GDP growth over the months. We know therefore when an economy is expanding or contracting.
As mentioned above a growing economy is positive for a currency, while a contracting economy is negative. This is always relative, as with the other two economic data mentioned previously, it depends on how the economy is performing against the quoted currency.
However, as we are talking about news releases and not the overall trend, you only need to be concerned with the currency which is about to have an economic data release. The reaction to the data may be short term, literally a matter of minutes, or it may be more extended if it matches the underlying trend. The reaction may also reverse the main trend if the released figure is exceptionally different from expectations.
For example a strong number is expected for Non-farm payrolls, but instead the release shows a much smaller increase or a loss of jobs. This is much less than the market was expecting. As the market had already priced in the expected figure you would most likely see the US dollar fall compared to most currencies.
Data releases are followed by various economists who try and figure what the most probable number to expect for the economic data release should be. The expectations for all data releases are well priced into the market leading up to the event. A good read of daily forex news is a must to gauge expectations and be aware of what is coming up next in terms of data releases and news events.
In the case of Non-farm Payrolls, as mentioned before due to its importance, large deviations from the expected figure can cause large bursts in volatility. For example if the market is expecting 200K new jobs, but the actual figure is 300K the surprise in the extra boost to the economy would usually cause the US dollar to rally sharply against most currencies. But keep in mind this is not always the case as there are others factors that can and will influence the price.
Below you can a price chart that illustrates an example of a Non-farm Payrolls were particularly good, at 916K compared to a forecast of 647K. Under normal circumstances such a large increase of the published number compared to the expectation would have caused a sharp rally in the US dollar. EUR/USD would have sunk like a stone in a pond, plummeting to new lows as the afternoon played out. From the 5 minute chart below we can see that there was some volatility created but rather subdued. The red circle indicates the 5 minute bar that started immediately after the news release.
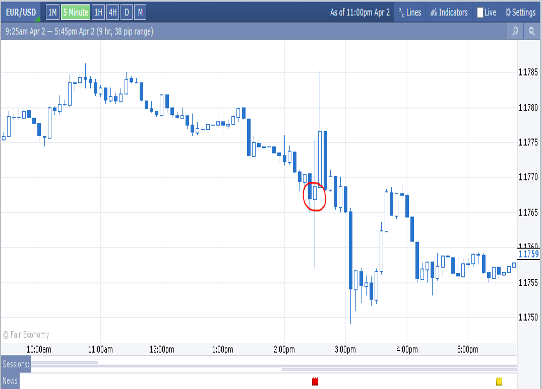
During this period in time, we had been seeing extremely large swings in jobs numbers due to the Covid 19 pandemic.
News Release Set-up
To have a good set up for trading data releases and news events you need to have good and timely information. The articles you will be reading from forex trading news sites will help you understand what the general sentiment for the market is going into the data release.
You can also setup a forex news feed this gives you access to the best forex news in a timely fashion. One place you can do this is Dailyfx. It requires a subscription but some news feeds are free.
The other source of information, which is a must, is a direct and timely print of the data releases from a forex news calendar. There are various places where you can see this info as it is published. Two well-known sites are the forex factory news calendar and the Street news calendar.
Both publish data on economic releases of countries from all over the world. So even if you are trading exotics or emerging markets you will still find what you need here.
For ECB monetary policy meeting statements you can also look for streaming coverage of the live event. This can be found directly on the ECB website. This allows you to watch the statement directly and more importantly listen to the answers to questions from reporters live.
How to Gauge Market Expectations
This is probably the trickiest part in setting up your trade: that is understanding what the market is expecting. I don’t look at short term charts, such as 1 minute or 5 minutes candles, as the market tends to flatten in the last hours leading up to the news release.
To get a feel of what the market is expecting I use the 30-minute, 1-hour or 4-hour candle charts.
The chart below shows the 30 min EUR/USD chart just before and after the GDP release for the USA on March 25.
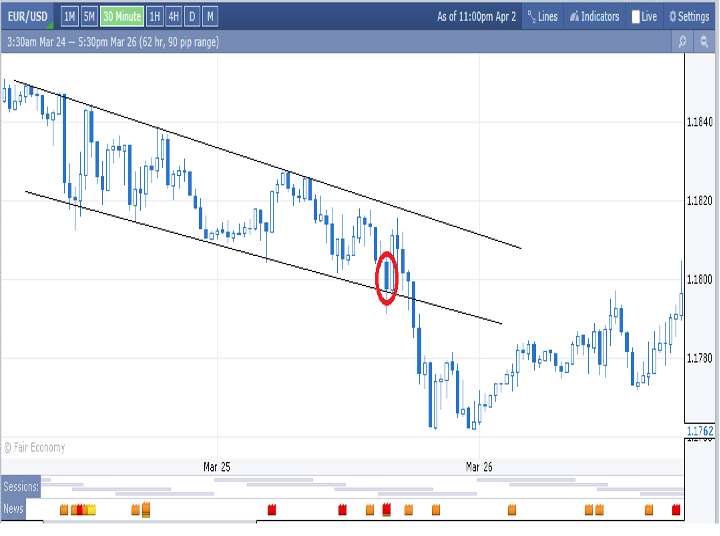
The red circle shows the bar at 2.30pm EST that starts with the release of the data. The preceding hours show a downward trend, with price action within the two downward sloping black lines. You can use various technical indicators but most likely the conclusion would be the same.
The market looks set to receive particularly good news for the US dollar in the coming data release. EUR/USD extends its decline after the release and continues, after some whipsaw price action, to decline to new lows.
The figure released was 4.3% with an expectation of 4.1% matching the previous estimate. 0.2% is not an extremely large increase, but as the market was already bullish on the dollar, a better than expected figure helps push EUR/USD lower and faster than the preceding hours.
Gauging Typical FOMC Meeting
The chart below shows the 4-hour candle chart for EUR/USD leading up to a two-day meeting FOMC meeting and beyond.
Previous price action shows a downward trend, with price action in between the two sloping black parallel lines. For the two days immediately prior to the start of the meeting we see sideways price action, two horizontal green lines. This is typical before an extremely important event such is the regular FOMC meeting.
Despite the EUR/USD showing a bearish trend leading up to the meeting the EUR/USD rallied immediately after the release of the FOMC statement. The red circle on the chart below indicates the candle that begins at the time the statement is released.
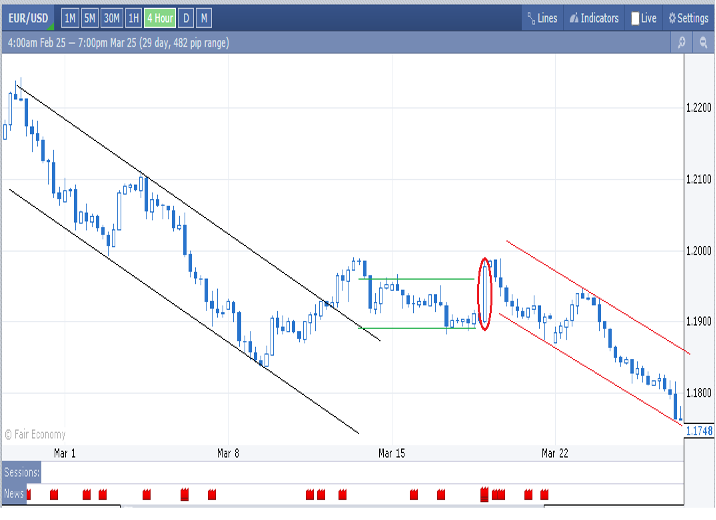
The Federal Reserve chairman Powell made comments that pledged renewed commitment to maintain the economic stimulus underway. This meant more bond buying and keeping interest rates low or lower for longer. As we mentioned earlier low, or expectations of lower interest rates are negative for a currency.
The market was obviously surprised and reacted with some volatility. Price started at 1.1907 for the 4-hour candle starting at 7pm EST. It then reached a high of 1.1988 on the successive candle. This price level did not break the previous most recent high on Mar 11 at 1.1990.
Clearly the statement was not in line with market expectations, and as we can see the rally was short lived. The market digested the news over the course of several hours and readjusted its downward course as the US dollar continued its rally.
Wrapping up
Trading news events is never going to be easy. We need to have all the tools available at our disposal. It is also a good idea to have a two screen set-up. One screen for your chart and one screen for the news feed. You don’t want to be switching from one window to another to check your charts and then back to check the news again.
Also extremely important is a good understanding of the macro economic factors in play. If you don’t understand the economic consequences of the factors in play it is hard to trade the market correctly.
Also a must is the information needed for expectations on the data to be released. You will not know if a release is good or bad or if it is going to bolster the current trend or reverse it, unless you know what the market is expecting. You will need to correctly gauge the general trend of the market going into the event. Then, you will be ready to determine if the news release will speed up the current trend or put it in reverse. As we have seen, some events provoke contrary results to the current trend when they take the market by surprise.
Another point for consideration is that there are considerable bouts of volatility immediately after a release, sometimes in the direction contrary to the general trend. Caution is needed when setting up stop loss levels, as too close a stop loss when trading these events may cause you lose money in the first few minutes, only to see that the trade would have been in the money shortly afterwards.