As in any business venture that you engage in, the ultimate success of that business will rely heavily on your understanding of various data points and financial figures. And that is certainly true as it relates to trading in the financial markets. Successful traders know that they need to track their trading performance on a regular basis so that they can continually improve the process to stay ahead of the curve.
Understanding Trading Performance
Within the financial markets, we often hear a lot of talk around trading performance and more specifically about how we might go about tracking and enhancing trader performance. But what exactly does that mean? Well, trading performance tracking refers to the process by which a trader can monitor, and evaluate various metrics related to their trade executions in an effort to optimize for better results.
There are literally dozens and dozens of different performance metrics that a trader can evaluate. The purpose of this article will be to provide you with a practical approach for gathering and analyzing the most important of these trade related data. When it comes to performance tracking, it’s best to adhere to the 80/20 principle. And that is to say that we should focus on the most relevant elements that will provide us the most insight, and help us to achieve the greatest percentage of benefit for our efforts.
Some traders tend to bypass the trade evaluation process altogether. This is a big mistake and one that will eventually catch up to those who downplay the importance of trade journaling and performance tracking. The importance of monitoring, evaluating, and optimizing your trading performance metrics cannot be overstated.
As with most data-driven approaches, it’s often said that what gets measured gets improved. And so, while some amateur traders consider the whole process of trade evaluation as an unnecessary tedious endeavor, professional traders have come to realize that it is one of the key ingredients to their trading success.
So how exactly should we go about tracking our trades, and what metrics should we be monitoring? Well the second part of this question will be addressed in detail in the later section, however, as for the first part of this question, let’s discuss some methods for trade journaling and performance tracking.
There are two primary means by which you can facilitate the data collection task. The first involves a more basic process wherein you would manually input the most important trading data, such as entry price, stop price, target price, average win, and average loss into a simple Excel-based worksheet, or a web-based program such as Google sheets. This is a more rudimentary and non-technical approach, but it is nevertheless, a great starting point for those just getting into the trading arena.
The second approach, involves utilizing a specialized program such as a trade journal software which can either be integrated with your broker’s platform or can serve as a standalone software. The benefit of the integrated approach is that that it will relieve you of much of the data entry required, as your broker’s platform will automatically send in all of the required trade data directly into the trading journal software. This approach is the recommended solution for those who are serious about data crunching and performance optimization as it relates to their trading strategy.
Achieving Peak Performance In Trading
Shortly we will be discussing some of the more data-driven characteristics of improving your trading performance in the market. But here, we will speak a bit about the psychological aspects of achieving peak performance in forex trading. Getting in and staying in a high performance trading mindset is essential to becoming a better, more consistent trader.
The point here is that both of these elements need to be diagnosed and evaluated to achieve optimal results. You can have a trading strategy with a distinct edge, but without the proper mental attitude or approach to the markets, you will inevitably wind up losing money.
And all the same lines, you could have the optimal type of mindset which is completely aligned with making profits in the market, however, if you do not have a discernible market edge, you will inevitably lose money. And so, these two components are intertwined. A trader will require both to achieve a desirable outcome from their trading activities.
The topic of trading psychology is very deep, and beyond the scope of this lesson, however, there is once one key mental paradigm shift that is worth mentioning here. More specifically, it relates to the way we, as traders, think about and associate winning trades and losing trades. Most traders are just fine dealing with winning trades, however they have some emotional issues when it comes to losing trades. And this is particularly true for novice traders.
So how can we deal with this mental obstacle so that it does not adversely affect our decision-making capabilities in the market? Well, one of the best ways that I have found is to start thinking about trading gains as revenue, and trading losses as expenses. It sounds ridiculously simple, however the implications can be profound.
Think about it for a second. If you own a pizza shop, would you feel emotionally drained or have negatively charged feelings, every time you had to pay your monthly rent to your landlord? Probably not, because as a business owner, you would understand that paying rent is a cost of doing business. And as such, it is a necessary expense, and not something to get overly emotional about.
As traders, we are in the business of trading the markets. And so, the gains that we realize on certain trades are actually revenue, and the losses that we realize on other trades are actually expenses. And so, we must make an effort to think in these terms.
Not only will this have the positive effect of your treating your trading as a real business, but also, it will go a long way towards neutralizing the negatively charged emotions that you feel with each and every losing trade.
Although this exercise may take some time to become second nature to you, it is well worth the effort of training your mind to think in these terms. It will free you up from this mental burden, and help you to think more clearly and trade from a more relaxed state of mind.
Trading System Performance Metrics
Many trading platforms have built-in capabilities for generating detailed trade data and statistics. A few of the well-known trading platforms that offer a rich array of statistical reporting and analysis include Tradestation, and Ninjatrader. Both offer an excellent engine for performance analysis. Below is an example of a performance report generated by Tradestation.
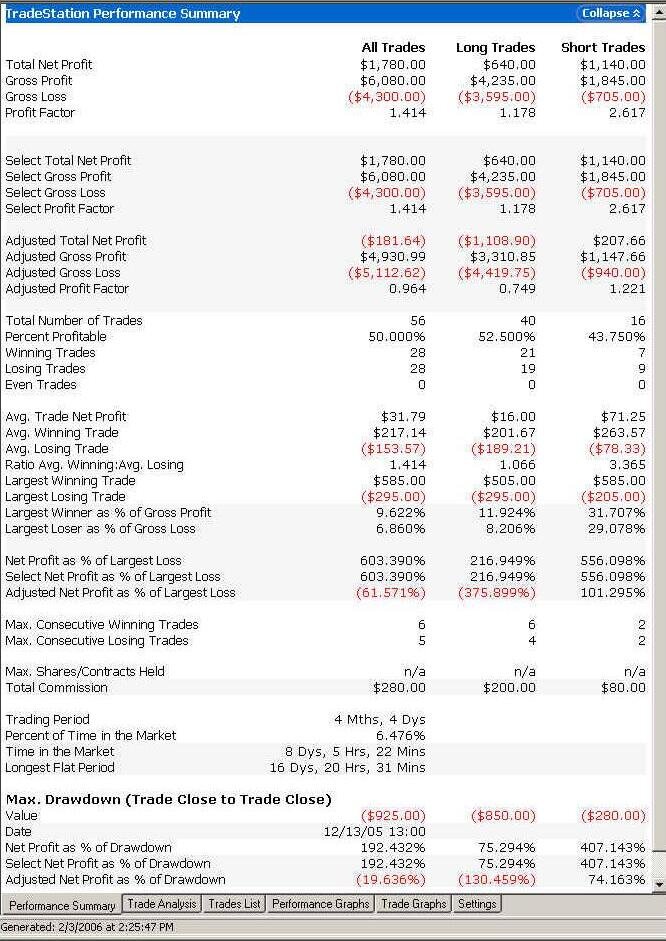
As you can see there are dozens of different metrics presented within the Tradestation performance report. Now the sheer volume of information presented within this report may seem daunting to many traders. But rest assured, you do not need to dig too deep into each and every one of these trade metrics presented.
There are just a handful of key data points within the Tradestation report, and similarly within other performance reporting dashboards, that we really need to pay close attention to. That is not to say that most of the other information is not of relevance, but rather, we should start with the most significant and revealing data within the report, and try as much as possible to keep the evaluation process simple and efficient. We do not want to create unnecessary confusion or be subject to paralysis analysis by becoming too immersed with each and every data point.
As such, here are the primary trade related performance data that we should focus on for any specified period that we are looking to analyze. This applies both to algorithmic trading performance evaluation and discretionary trading as well.
Total number of trades – Total number of trades reveals how many closed trades that the trading strategy or system generated. This will allow you to gauge whether you are trading too frequently, not frequently enough, or just right based on your trading plan.
Percentage winning trades – This is the percentage of your total trades that resulted in a profitable outcome. Winning trade percentages should always be compared in relation to your average win amount to the average loss amount ratio. Generally, within most trading systems, the higher the win percentage the lower your average win amount will be, and vice versa, the lower the win percentage, the higher your average win amount will be.
Largest winning trade – This is the largest winning trade that was achieved during the period analyzed. If you rely on just a few big trades to contribute to your overall expected returns, this is a particularly useful metric to know. Having said that, you want to be careful with this metric as it may not be statistically significant or repeatable.
Largest losing trade – This is the largest losing trade that was incurred during the time period analyzed. This figure should be incorporated into your risk management strategy. If you have a tendency for letting trades run into big losses, then you may need to create a better plan for minimizing these types of losses by incorporating a more stringent stoploss methodology or some other related action.
Average time in trade – This is the average holding period for your closed trades. This will help you to know recognize the frequency and quantity of trades that you can expect to generate. Additionally it’s important to know whether you are holding onto losers too long, or cutting your winners too short. The average time in trade metric can help you assess this.
Maximum drawdown – Maximum drawdown provides you information on the largest peak to valley drop within your trading account. Essentially it tells you the maximum amount of loss that your account has incurred from a prior peak level. This is one of the most significant performance metrics in trading. Every trader should know what their system or strategy’s maximum drawdown level is and utilize that information to build a robust risk containment plan.
Profit factor – Profit factor is an extremely useful trading strategy performance metric that takes into account both your winning trade totals, and losing trade totals. The profit factor is calculated by dividing your aggregate gross losses from your aggregate gross profits. It’s a simple but elegant performance metric that can provide a quick snapshot into the viability and profitability of a trading strategy.
Net profit – Net profit is calculated by deducting the gross losses and gross profit. Some trading platforms that track commission and other related trading costs will also deduct these amounts to arrive at its net profit amount. The latter is a more realistic figure since commissions and other related costs are true costs that have been incurred.
 Avoiding Performance Tracking Pitfalls
Now that you have a good understanding of why it’s important to track your forex trading performance, and the different types of performance related metrics that you should be evaluating, let’s now discuss some of the common pitfalls that you’ll want to avoid during this process.
Here are some points to consider when evaluating and modeling trading system performance:
Statistically significant data set – In order to get accurate and reliable results from performance report data, you must ensure that you have a statistically significant data set. In other words, you want to make sure that there are enough trades within the data set to be able to arrive at logical conclusions.
For example, A forex performance tracking report that incorporates several hundred trades is much more reliable than a report based on just twenty or thirty total trades. The larger the occurrences being analyzed, the higher the confidence level you can put on the resulting figures.
Tracking too many less useful metrics – Obviously when it comes to data, we would prefer to have more rather than less. However, when we are evaluating our strategies performance figures, we want to avoid micro-analyzing every single piece of trade related output. In a sense, we must not lose sight of the forest, for the trees.
We have to try to stay laser focused on the most important trading performance data, and work on improving and optimizing our trading strategy based on those significant data points.
If we try to micro analyze everything within our trading performance reporting dashboard, we will begin to lose sight of the main reason for performing this exercise, which is ultimately to use the data to help improve our trading process and results going forward.
Segmenting data by strategy type – One of the most common mistakes that traders make when trying to evaluate their trading performance is that they do not take the time to segregate their data, but rather combine all of their trades within one master report.
Although it seems like a tedious task to try to separate different strategies or trade setups, doing so, will provide for a more granular and specific performance report which will serve to be much more useful. For example, if your trading two different types of setups, wouldn’t it be helpful to know how each performed on an individual basis, and what the makeup of the data reveals for each?
Implementing changes to your trading program – The whole point of taking the time to journal your trades, import them into your trading platform, and then evaluating the performance figures is to assist you in trying to overcome those areas in your trading that you may be struggling with, and helping you to recognize those areas in your trading that you are strong in.
But the fact of the matter is, some traders feel hesitant in believing what the performance data reveals, and often avoid making the needed changes to help them achieve the incremental improvements that they are looking for. This seems counter intuitive, however it is something that occurs all too often. Even after we’ve recognized what we need to do to achieve our desired results, it’s very difficult to make those behavior changes that are required of us.
Closing Thoughts
As traders, we spend a countless number of hours researching and applying different trading methodologies in the market, in an effort to find something that works. This is certainly an important element to trading success, and part of each trader’s journey. However, the one thing that is often overlooked is performance evaluation. Many traders have come to know at an intuitive level which set ups work well for them, and which ones that they struggle with.
But, in order to truly harness the power of incremental improvement, traders should have a process for periodically studying and evaluating their performance metrics. And the good news is with today’s trading technology, the process of data crunching and performance reporting can be quite simple, requiring just a few mouse clicks. As such, there is no plausible reason to bypass this important step in helping you move further along your trading journey.