The term “Black Swan” is used within the context of the financial markets to describe an event that comes as a surprise but has a significant effect on the world. A popular book that also helped coin the black swan event definition was Black Swan by Nassim Taleb. He is also considered the founder of today’s black swan theory.
We will discuss a list of black swan events that hit the financial markets by surprise and had a major effect on investors around the world. From the 1929 Great Depression to the more recent 2020 Global Lockdown, these events resulted in decimating entire economies, stocks, and currencies.
The 1929 Great Depression
A textbook black swan event example – and one of the most devastating black swan events in history – is the 1929-1933 Great Depression. This event was so severe that it is often used by economists to describe how intense a financial crisis can hit the world economy.
The Great Depression started in the United States with the stock market crash of October 29, 1929, also known as the Black Tuesday. This flash crash caused a worldwide decline in stock prices and a severe reduction of the global economic output.
Worldwide, the Gross Domestic Product fell by around 15%, while international trade declined by a whopping 50%. By comparison, the 2008 Great Recession saw the global GDP falling by less than 1%. In the United States, unemployment skyrocketed to 23% from 5%, and personal income fell dramatically.
Although some countries began to recover by the mid-1930s, other countries felt the negative effects until the beginning of World War II.
While the causes of the Great Recession are still not crystal clear, some economists believe that the sudden crash of the stock market led to lower investor confidence, which in turn caused a reduction in consumption and investment spending.
As deflation hit the economy and prices started to fall, many people believed they would be better off by reducing the spending even further in anticipation of even lower prices. As a result, the extreme drop in demand has catastrophic consequences on the US economy, which later spread to other countries globally.
Another popular theory is the monetarist explanation, which believes that the shrinking in money supply was the main cause of why an ordinary recession turned into one of the greatest economic downturns.
Finally, some economists blame the gold standard to be the primary transmission mechanism of the Great Depression. However, it was the suspension of gold convertibility that made economic recovery possible. Almost every major currency left the gold standard during the Great Depression.
In 1931, the United Kingdom ceased exchanging pounds for gold after a series of speculative attacks on the currency, which made the country one of the first to recover from the economic downturn.
Japan and the Scandinavian countries followed the UK and left the gold standard in 1931, followed by Italy and the US. Some countries, like France, Belgium, and Switzerland, stayed on the standard until 1936, which caused a slower economic recovery than countries that had freely floating currencies.
Although the Great Depression is reaching its 100th anniversary, it still provides valuable lessons to traders and investors about how severe an economic downturn can be, and how pegged currencies can prove to be a major hurdle for recovery.
The 1997 Asian Financial Crisis
One of the more recent black swan event examples in the financial markets was the 1997 Asian financial crisis. Countries that were once known as “Asian tigers” and “Asian economic miracles” saw their currencies and stock markets lose about 70% of their value.
Indonesia, South Korea, and Thailand were the most affected by the crisis, followed by Hong Kong, Laos, Malaysia, and the Philippines. Singapore, Taiwan, and Japan also felt the consequences of the crisis, although to a lesser extent.
Asia, and particularly Southeast Asia, attracted almost 50% of all capital inflows into developed economies in the years before the crisis. Economic growth was outstanding with GDP growths as high as 8-12%, and the affected countries were mostly believed to have sound fiscal policies. However, higher interest rates and economic growth in the region also attracted speculative money that searched for a quick profit. Asset prices kept rising, forming a bubble that required even more capital to be maintained.
The crisis started with the collapse of the Thai baht on July 2, 1997, after the government lifted the currency peg to the US dollar due to lack of foreign reserves. As a result, capital outflows started almost immediately, leading to a sharp sell-off in the Thai baht, and later in other Asian currencies as well.
The fact that south-east Asia accumulated a huge pile of foreign debt made the devaluation of their currencies even worse. During the period 1993-1996, foreign debt-to-GDP ratios in the ASEAN economies rose from 100% to 167% and peaked beyond 180% during the worst of the crisis.
Figure 1Source: www.grips.ac.jp
Currency markets were the most hit during the crisis. The Thai baht fell from 24.5 bahts per USD in 1997 to a low of 41 bahts per USD in 1998, reflecting a fall of 40%. The Indonesian rupiah was hit the most. The currency slumped from 2,380 rupiahs per USD to a low of 14,150 rupiahs per USD, marking a fall of 83.2%.
The 2000 Dot-Com Crash
A black swan event that most equity traders remember occurred on April 14, 2000, when the Nasdaq Composite index fell 9%, completing a weekly fall of a whopping 25%. The dot-com bubble, also known as the Internet bubble, was a bubble in the stock market in the late 1990s, mostly fueled by excessive speculation in internet-related companies.
The advance of the internet and massive adoption of computer technologies nursed many new companies that were focused on the internet, including names such as Pets.com, Webvan, and Boo.com. By 1997, almost 35% of all American households owned a personal computer, which marked an important shift to the Information Age.
Speculative capital began to flow to newly-founded companies that were mainly focused on delivering their services over the internet. Investment banks were also profiting from a surge in IPOs and encouraged investment in the new internet companies.
At the peak of the dot-com bubble, internet companies were able to become public companies and organize an IPO without a penny of profits. People started quitting their jobs to trade the financial markets, and many employees who received stock options became instant millionaires.
In 1999, the Super Bowl XXXIII had two dot-com companies purchasing ad spots for the popular sports event. One year later, that number grew to 17 dot-com companies, with each company paying around $2 million for a 30-second commercial.
Some popular investors, such as Mark Cuban and Sir John Templeton, anticipated that the excessive valuation of dot-com companies wasn’t sustainable and started shorting the market or hedging their long exposure right at the peak of the bubble.
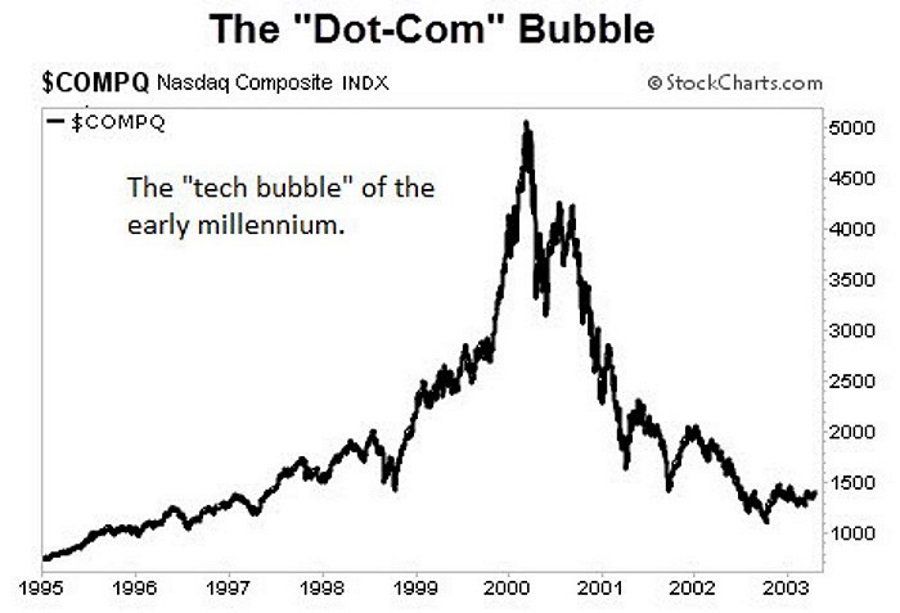
Between 1995 and 2000, the Nasdaq composite index rose 400% and fell 78% in the following months, giving up all its gains in the previous few years. Some popular companies, like Amazon and Cisco, were also hit hard but managed to survive the drop in their market capitalization.
The bursting of the bubble was initiated by several smaller events. First, former Fed governor Alan Greenspan announced that the central bank is planning to hike interest rates in 2000, which led to increased market volatility and concerns of higher borrowing costs for internet companies.
Then, Japan entered into a recession in March 2000, triggering a worldwide sell-off in internet companies and technology stocks. In November 2000, Pets.com, a popular internet company that had its IPO only nine months earlier announced bankruptcy, which led many investors to rethink their investments in dot-com companies.
And finally, the September 11 attacks in 2001 accelerated the sell-off in dot-com companies even further. At its bottom, the Nasdaq index lost a whopping 78% from its peak, marking the end of this black swan phenomenon.
The 2008 Great Recession
One of the more recent black swan events was the 2008 Great Recession, also known as the global financial crisis.
This was a severe financial crisis that started with the housing market bubble in the United States and quickly spread to the rest of the world. Commercial banks took excessive risks with mortgage-backed securities which fell in value dramatically after the bursting of the United States housing bubble.
Many economists consider the 2008 financial crisis to be the worst economic meltdown since the Great Depression of 1929. The Financial Services Modernization Act of 1999, also known as the Gramm-Leach-Bliley Act, allowed banks to use customer deposits to invest in financial derivatives.
Mortgage-backed securities were one form of those derivative securities in which banks took excessive risks by lending to homeowners with questionable credit ratings.
In 2006, the housing market in the United States started to lose value for the first time in decades. Most banks didn’t take the risks seriously and kept purchasing mortgage-backed securities that were highly profitable at the time. However, as the housing market kept falling, those securities lost most of their value and left banks with a pile of worthless financial instruments.
The financial crisis that started with the bursting of the housing market culminated with the bankruptcy of Lehman Brothers on September 15, 2008, which sent shockwaves through all of the major global markets.
Other banks and insurance companies, often described as “too big to fail”, received generous help from the government to avoid further bankruptcies. On September 16, the Fed loaned $85 billion to AIG as a bailout, and the US Treasury took over mortgage companies Fannie Mae and Freddie Mac for $187 billion.
On September 20, 2008, the US Treasury and the Fed provided a $700 billion bailout package for the country’s money market, but the bill was blocked in Congress until October 1, 2008, after global stock markets almost collapsed.
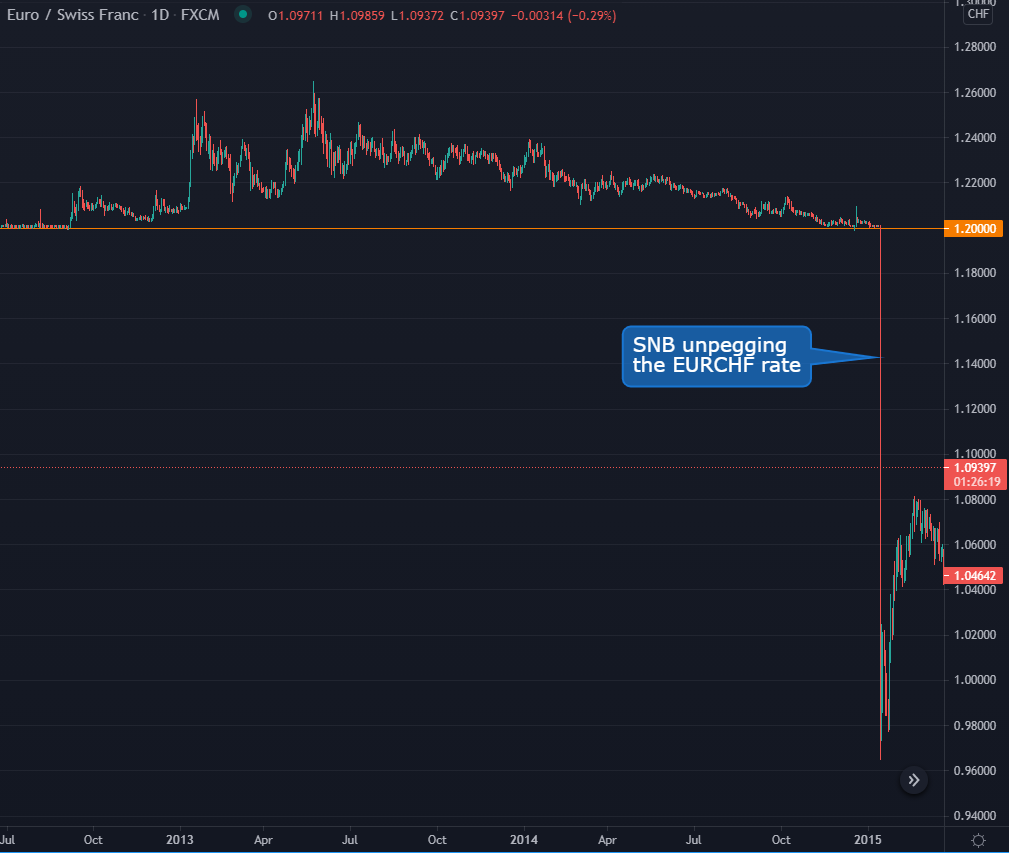
The 2015 Scrap of the CHF Peg
A special treat for Forex traders is this black swan risk event that happened in the currency markets. It’s a textbook example of how sudden and unexpected events can catch the markets unprepared.
On January 15, 2015, the Swiss National Bank shocked markets by scrapping the peg of the Swiss franc of 1.20 against the euro. This sent shockwaves through the currency markets, and the Swiss franc immediately appreciated by an astounding 30%, reaching a rate as high as 0.90 against the euro.
The central bank pegged the Swiss franc to the euro in 2011 during the European debt crisis, in order to prevent the currency from appreciating too much and deteriorating the country’s export competitiveness.
Currency traders will gladly explain that the Swiss franc is a safe-haven currency that attracts capital flows during times of economic and political uncertainty, as was the case during the European debt crisis. Investors began to park their money in Swiss francs during that period, which put immense buying pressure on the currency.
This daily chart shows the dramatic effect of the SNB move on January 15, 2015.
While nobody outside the Swiss National Bank knows the real reasons behind the move that sent the Swiss franc sky-rocketing and hurting Swiss exporters, there are a few theories in circulation.
The first theory states that Switzerland saw the Eurozone as fragile during the European debt crisis and didn’t want to risk the Swiss franc to stay pegged to an ever-weakening euro. Another theory that is floating around says that Switzerland wants exchange rate parity with the euro.
Whatever the reason behind the move, the unpegging of the Swiss franc to the euro had dramatic consequences on the financial markets. Many Forex brokers suffered heavy losses as traders were positioned on a rising EUR/CHF rate, believing that any move below 1.20 would be short-lived, and profiting on any small move to the upside.
In addition, hundreds of thousands of people across Europe who had their mortgages denominated in Swiss francs (because of the currency’s stability during the 2008 Financial Crisis and relatively lower interest rates) saw their obligations rising dramatically after the SNB’s move on January 15, 2015.
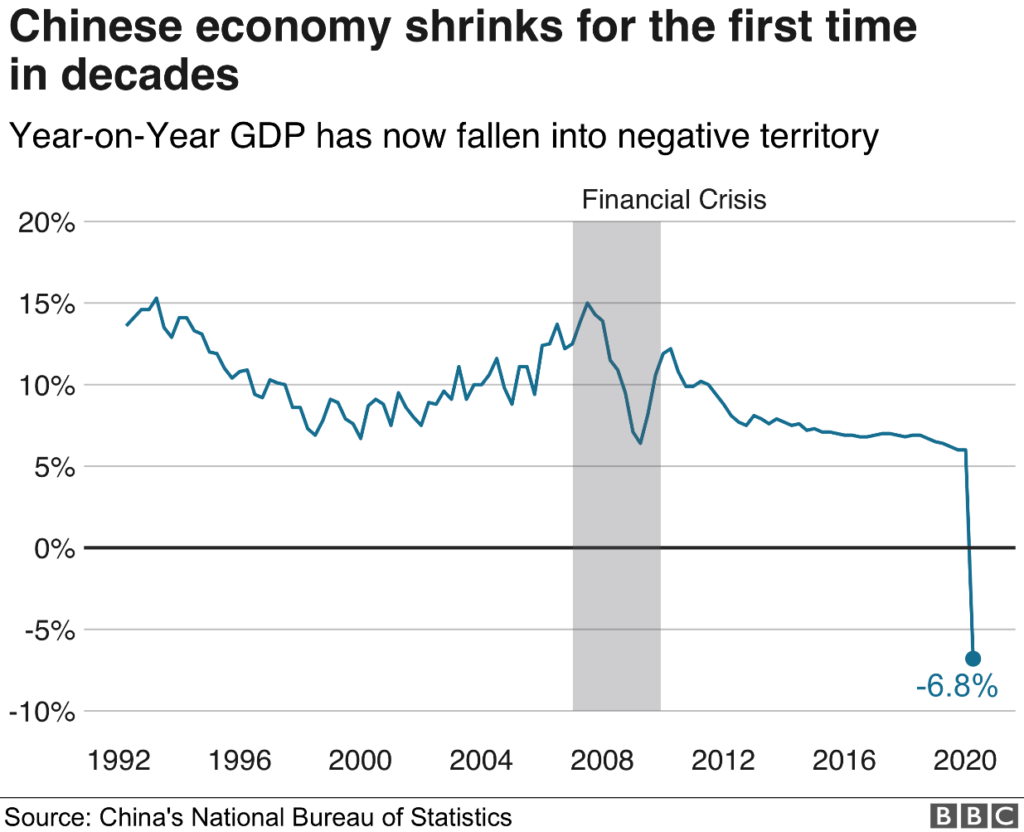
The 2020 Lockdowns
Unlike other black swan examples, the coronavirus pandemic that started in late 2019 in China and rapidly spread to the rest of the world in 2020 has resulted in a tragically high number of lives being lost. Besides the human side of the suffering, the disease also triggered the worst economic downturn since the 1929 Great Depression as countries entered into lockdowns, the global flow of goods and services slowed down dramatically, and 20 million people lost their job in the United States alone – in a single month.
In the April edition of IMF’s World Economic Outlook, the institution anticipated global economic growth in 2020 to fall to -3%. In June, the IMF lowered their global growth forecasts by another -1.9% to -4.9%.
The economic shock was so severe that China has seen its first economic contraction in decades. For comparison, the world saw the global economic output in the 2008 Financial Crisis decreasing by -0.1% on a year-on-year basis.
In February and March 2020, during the peak of global pessimism and national lockdowns, the S&P 500 lost a whopping -35.5% in a few short weeks – a fall not seen in modern history. The Dow Jones Industrial Average lost -38.5%, while the US dollar – a traditional safe-haven currency – surged almost 9% during the same period of time.
Many economists discussed what the path of economic recovery would look like. V-shaped, L-shaped, U-shaped, and even W-shaped recovery predictions were on the table, with the letter representing the path of the stock market.
Due to the unprecedented amount of government help, fiscal spending, and quantitative easing initiated by countries around the world, markets have recovered in a V-shaped form. Most global indices, including the S&P 500 and the German DAX, hit new record highs only months after the worst fall of stock prices in history. Nevertheless, some sectors were still lagging behind the general market movements as of May 2021, most notably airlines, companies that operate in the fields of traveling and tourism, and service companies that require direct human contact.
Cryptocurrencies, such as Bitcoin and Ethereum, also reached all-time highs as cheap money and speculative interests pushed most asset classes higher. While some argue that we’re entering a stage of market bubbles, only time will tell whether the world economy has been able to completely recover from the worst pandemic since the Great Plague.