One of the reasons why technical analysis continues to be such a popular method of analysing and trading the markets, is because of the vast range of different methods available to traders. From raw price action reading to chart patterns and indicator analysis, traders are able to explore and change methods until they find a system that works for them. In this article, we will discuss an important candlestick pattern. Specifically, we will learn how to identify and go about trading the Piercing line candlestick pattern.
Candlestick Reading
One area of technical trading in particular that features a wide and exciting range of options, is candlestick reading. Candlestick reading is at the very core of technical analysis. Within candlestick reading, there is a large selection of options to choose from including analysing individual candlesticks through to complex candlestick patterns. In this article, we are going to take a look at a mid-level candlestick formation known as the piercing line pattern.
Before we move onto looking at this pattern and how to trade it, however, let’s just quickly make sure we are all on the same page with candlestick reading and why it is so important and useful to traders.
Why Are Candlesticks Important?
Candlesticks are one of the most popular ways of displaying the price information on trading charts. The reason why they are so popular is that they provide a really quick visual guide which contains a lot of important information.
Candlesticks are a super useful reflection of what is going on with the underlying order flow in the market. So, at their very basic level, candlesticks tell us four things about the movement in price during that session. The open, the high, the low, and the close. Furthermore, a red candle tells us that price closed the session lower than it started and a green candle tells us that price closed the session higher than it started.
Now, along with that basic information, the shape and size of candlesticks also gives us a lot of information about the underlying order flow action during that session. For example, a large green candle tells us there was heavy buying over that session because price closed much higher than it opened. Similarly, a large red candle tells us that there was heavy selling over that session because price closed much lower than it opened.
Now, once we have developed a foundational understanding of what individual candlesticks are telling us about underlying order flow action, we can then start to step things up and look at what combinations of candlesticks, or candle stick patterns, are telling us about the market and from there we can start to form a trading idea. So, without further ado let’s take a look at the piercing line pattern.
Piercing Line Candlestick Pattern Example
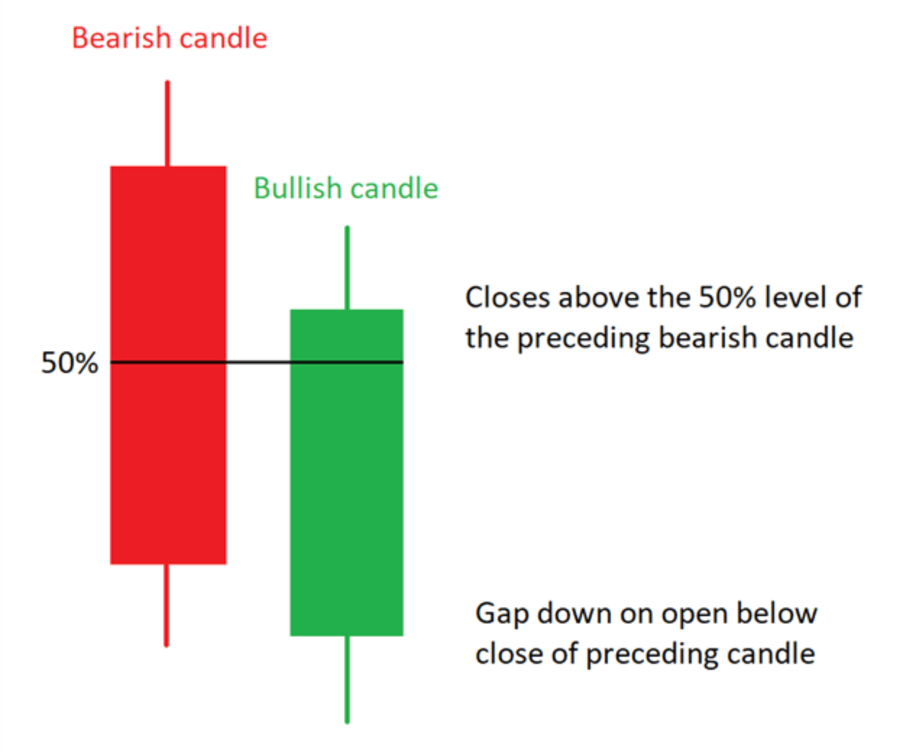
We identify a bullish piercing line pattern as follows. Following a bearish candle, the next candle (which is a bullish candle) gaps lower (opens below the close of the previous candle) and then closes back above the 50% retracement of the prior candle (closes above the midway point of the preceding bearish candle). The forex piercing line candle formation is simply a two-candle pattern.
That’s it, very simple to spot. Essentially what this piercing line chart pattern is highlighting for us is a sharp shift in sentiment in the market. So, we know that sellers were in control initially, driving price lower over the course of the bearish candle. Price then gaps lower at the next candle, telling us that was an intensification of selling.
However, at the low of that next candle, buyers stepped in, in force, and drove price sharply higher to the extent that price closed above the midway point of the prior candle. This tells us there has been a sharp shift in sentiment and alerts us to the potential for a continuation higher, offering us buying opportunities.
Bullish Piercing Line Pattern Example
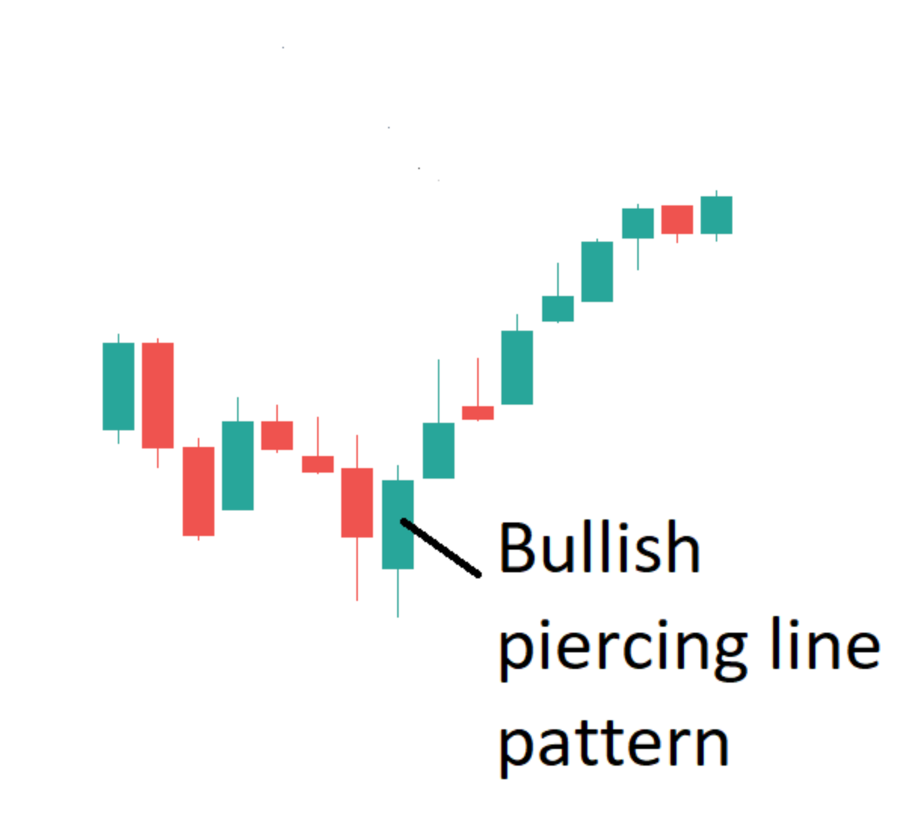
So, in the image above you can see a very clear example of this pattern occurring on the charts. Price is moving in a clear downtrend initially and near the lows of the move we see a bearish candle form. On the next candle, we then see price gapping lower (opening below the low of the prior candle) before buyers step and price reverses higher. This bullish candle then closes above the midway point of the prior candle, confirming our piercing line candle pattern.
How To Trade The Piercing Line Pattern
So, in terms of how we would trade this pattern, we can set a buy order as price breaks above the high of the bullish candle and our stop goes below the low of that entry candle. From there we then look to target a minimum of twice our risk to ensure positive risk-reward.
The beauty of this pattern is that it acts as an early warning sign to a potential bullish reversal. Additionally, because the market is moving lower at the point the pattern occurs, unless you are trained in reading candlesticks and know this pattern, then this trade idea wouldn’t occur to you. As such it can be a great way of gaining a unique entry point in the market that only certain traders would know about.
This is one of the best things about candlestick reading. Because you are learning to analyse the raw price action itself and what it is telling you about the underlying order flow in the market, you will very often find that you are able to gain a better entry point to a move.
For example, if you are looking at a bearish trend and waiting for price to break above a trend line in order to take a bullish reversal trade, very often you will find that you are gaining entry quite late in the move. However, learning to read candlestick patterns such as this one, you are able to be much more reactive to and in tune with changes in the market.
Knowing this pattern helps you understand the underlying order flow action driving the market. Knowing the shift that needs to have occurred in order for this candlestick pattern to form, we are able to establish a buy position built on a solid trading premise. And we can do so relatively early. This gives us a much tighter stop and means that if we are looking to keep our trade open, perhaps if using a trailing stop method, we have the potential to secure a much bigger profit.
Now, along with just trading this pattern as a stand-alone system, we can also look to use it in combination with other technical elements. Establishing confluence between technical methods is one of the best ways of analysing and trading the market as it gives us an increased chance of success with our trade idea.
Piercing Line Pattern with Indicators
So, because we know this is a bullish reversal pattern, we want to look to identify the pattern at areas where we would expect to find a bullish signal such as a test of support, or a retest of broken resistance, or even a test of a bullish trend line. Another way of establishing confluence, however, is by using technical indicators. If we look to combine our piercing line pattern with a bullish signal on a technical indicator, we know the pattern has a much higher chance of playing out in our favour.

So, looking at the image above you can see a great example of this system in play. On this chart, we have the stochastics indicator turned on. The stochastics indicator is a tool that measures momentum in the markets and tells us when price moves are either overextended to the downside, and price is therefore vulnerable to a reversal higher, or when price moves are overextended to the topside and therefore vulnerable to a reversal lower.
So, you can see that as our piercing line pattern has formed, the stochastics indicator is giving us a bullish signal. The indicator was moving lower as price was moving lower, then at the point that the pattern occurs, the stochastics indicator crossed below the lower threshold and then crossed back above. So, we know that momentum in the market was overextended to the downside and therefore price is vulnerable to a reversal higher, and we then see our piercing line pattern form, telling us there has been an order flow shift.
Once we see these two signals occurring at the same time, we know we have a solid bullish signal in place, and we can anticipate a reversal higher is coming. So, once again we can go ahead and enter a buy trade as price breaks above the bullish candle high, with our stop placed below the low of the bullish candle. We want to target a minimum of twice our risk to ensure a positive risk reward on the trade.
Now, as we pointed out at the start, the piercing line candlestick formation can also be used as a bearish setup. In the bearish example of the pattern, the parameters are simply the inverse of those found in the bullish pattern. So, we identify the bearish version of the pattern by firstly, seeing price trading higher within an uptrend. At the peak of the move, we see a bullish candle followed by a candle which gaps higher (opens above the close of the prior candle) and then reverses to close below the mid-way point of the prior candle. And this serves as the piercing line candlestick confirmation for the bearish variety.
So, the presence of this candlestick formation tells us that buyers were in control initially, driving price higher. There was then an intensification of buying causing the gap higher before sellers stepped in, in force, and drove price lower to the extent that price closed below the midway point of the prior candle. Once again, this pattern highlights a sharp shift in sentiment in the market, this time alerting us to the potential for a continuation lower and a broader bearish reversal to play out.
Bearish Piercing Line Example
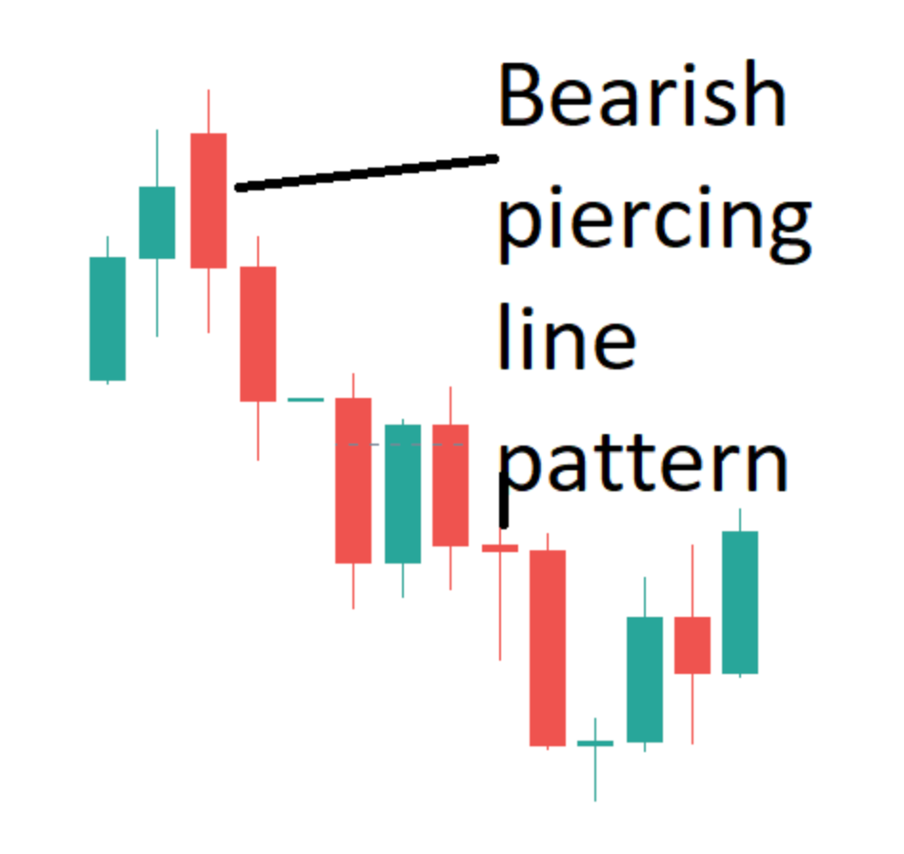
So, in the image above you can see an example of this pattern forming in the charts. Price is moving higher but at the peak of the up move, we see price gapping higher only to reverse and close heavily lower. So, once we have established our bearish piercing line pattern, we can go ahead and enter a sell trade as price breaks below the low of the bearish candle. Once again, we place our stop above the high of the bearish candle this time (because we are in a sell trade this time) and we then target at least twice our risk.
As with the bullish version of this pattern, we are able to gain a great entry to the ensuing reversal. Because we understand that there has been a strong bearish shift in the market in order for this pattern to form, we know that there is a strong chance that price is going to continue lower in the wake of the pattern forming. From there we can capitalise on the bearish reversal. This is the beauty of the piercing line pattern in technical analysis
As with the bullish version of the pattern, we can look to enhance our chances of success when trading this pattern by looking to establish confluence between the pattern and an indicator reading. We saw earlier how we can use an overextended reading on the stochastics indicator to identify a trading signal which is confirmed by the presence of the piercing line pattern.
Another indicator we can use is the RSI indicator. Similar to the stochastics indicator, the RSI indicator can be a very useful tool for establishing confluence to place a sell trade. Instead of just identifying when momentum is overextended, another way we can use momentum indicators such as the RSI or stochastics to identify divergence.
Divergence refers to a situation where the moves happening in price aren’t being supported or confirmed by the indicator.
Bearish Piercing Line With RSI
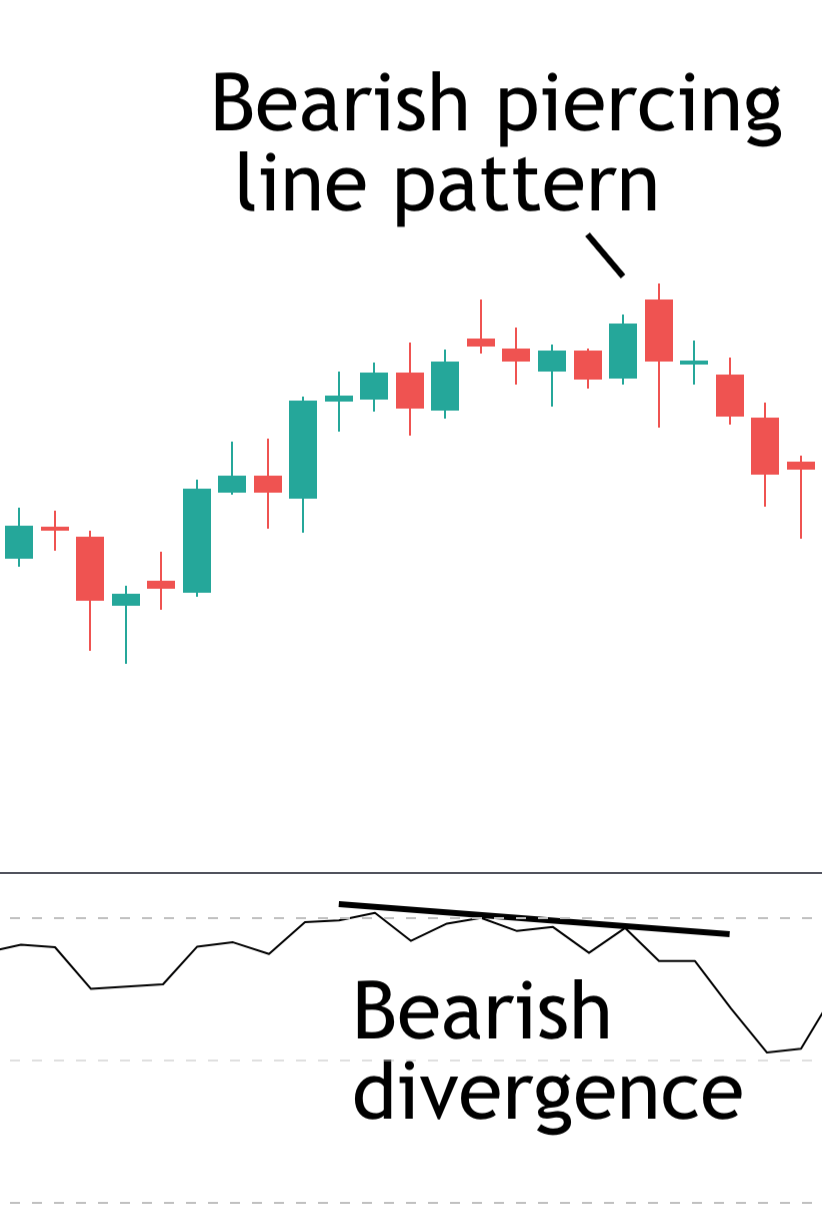
So, in the image above you can see an example of a bearish piercing line candlestick in an uptrend with the RSI indicator in the sub-panel below. Now, notice what is happening with the RSI indicator at the point this pattern forms.
We can see that price is in an uptrend and is also testing a resistance point (a former swing high). You can see that the RSI indicator is actually putting in a lower peak against the initial peak, telling us there is bearish divergence in the market (bullish momentum is weakening) and alerting us to the potential for a reversal lower. At this point, we then see our piercing line pattern form. Because we know what the pattern tells us about the underlying order flow shift in the market, we can go ahead and place our sell trade as price breaks below the low of the bearish candle.
Final Thoughts
So, now you can see just how simple and effective the forex piercing line candlestick pattern can be when looking for unique trading points in the market. Because of what the pattern signifies about the underlying order flow shift in the market, we can use this piercing line trading in any market (forex, stocks, equities, commodities) and we can also use it to trade on any timeframe. So, whether you prefer to trade on the higher timeframes or prefer to scalp on the lower timeframes, this setup is valid.
As always, the best advice is to spend time identifying the pattern and train your eye because sometimes the gaps which occur during the formation of the pattern can be quite slender so you might miss them at first. And remember, when taking trades, always use a stop loss and focus on looking to achieve positive risk-reward by targeting a minimum of twice your risk.