The ADX trend strength indicator is one of the most widely used tools to determine the strength of a trend in the security being analyzed. Technical traders typically use the ADX (Average Directional Index) or Average Directional Movement Index (DMI) indicator to determine whether the markets are in an uptrend, downtrend or trendless condition.
The ADX indicator essentially helps traders to understand if the market is trending, and if so, how strong or weak the trend is. Utilizing the information from the ADX indicator traders can know when to take a position in a trend and when to stay away from the markets when the trend is flat.
This information can be very valuable to the trader, since markets typically trend only 30% of the time, while it trades in a sideways range about 70% of the time. For most traders, the biggest losses usually come on average in sideways market. Thus, the ADX or the DMI indicator can provide clues to the technician regarding the most opportune times to engage in a potential trade.
Identifying trends in the forex markets are one of the most important aspects of technical analysis. Without knowing what the current price trend is, it can be difficult for traders to properly execute a strategy. Trends can be analyzed in various ways including price action analysis, Elliott Wave counts, moving averages and other technical means. But the adx technical indicator is one of the few technical indicators designed to gauge both the trend direction and trend strength.
The Directional Indicator was first introduced in 1978 by J. Willes Wilder Jr. Wilder introduced the readers to the directional movement indicator in his book, New Concepts in Technical Trading Systems.
Wilder also introduced many other technical indicators including the average true range (ATR), the parabolic SAR as well as his most famous indicator, the Relative Strength Index or RSI indicator. All of Wilder’s technical indicators have stood the test of time and are commonly used in the financial markets.
Charles Dow and Market Trends
The concept of market trends was first postulated by Charles H. Dow, in his famous Dow Theory. Charles Dow is one of the founders of the Dow Jones Newswire Company. The Dow Theory goes in detail about the different types of trends in the market. While there are many aspects of technical analysis covered by the Dow Theory, a major part of the theory focuses on trends.
According to Charles Dow, trends are primarily made up of major, intermediate and minor trends. These trends are applicable to any liquid financial market. Charles Dow also gave a brief timeline on the duration of the trend. For example, the major trend is said to last from a few months to a few years. This is the longer term overriding trend in the market. Such markets are often referred to as bull or the bear markets.
The intermediate trends are those that fall within the major trend. The intermediate trends are often counter trending to the major trend and in most cases, considered to be a correction or a retracement to the major trend. The intermediate trends tend to last from a few weeks to a few months.
Finally, the minor trends can last from a few days to a few weeks. These can follow the major trends and consist of counter-trend retracements or corrections as well. It is important to note that the time frame given for each of the trends by Charles Dow is just an approximation and not absolute periods.
At any time, any market in question exhibits one of these trends (major, intermediate or minor). For forex traders, what this information means, is that, based on the time frame being used, the appropriate trend can be analyzed. For example, the primary trend can be found on the monthly chart. The secondary trend can be seen on the daily or weekly charts and finally, the minor trends can be seen on the lower time frame charts such as the 240 minute or hourly time frame.
What is the Average Direction Index (ADX) Indicator?
As we have described earlier, The Average Direction Index is a technical indicator that gauges both the strength and direction of a trend in a security being analyzed. This security can be anything; an index, such as the S&P500, a stock such as AAPL or a forex currency pair, for example the EUR/USD.
The ADX trend indicator is commonly used to compliment other technical methods or indicators to build a trend following trading system. Other technical studies that are often used in conjunction with ADX include Moving Averages, Bollinger Bands, Trend lines, and simple horizontal Support and Resistance levels.
The Average Directional Index or ADX comprises of three main elements.
- +DI
- -DI
- ADX Line
The +DI and -DI depict whether the trend is bullish or bearish based on their crossover behavior.
The ADX line shows the strength of the trend.
When you combine the information from all three components, you can derive a picture of the existing market condition. The +DI and –DI will tell you the direction of the market, while the ADX line shows the strength of this directional movement. The ADX indicator is depicted in the sub-window of the price chart (similar to where technical oscillators are plotted).
There are many different techniques to build a robust ADX trading strategy, and we will discuss a few in this lesson later on.
Let’ now turn our attention to Figure 1 below. Here we have a GBPUSD chart that shows the adx indicator in mt4.
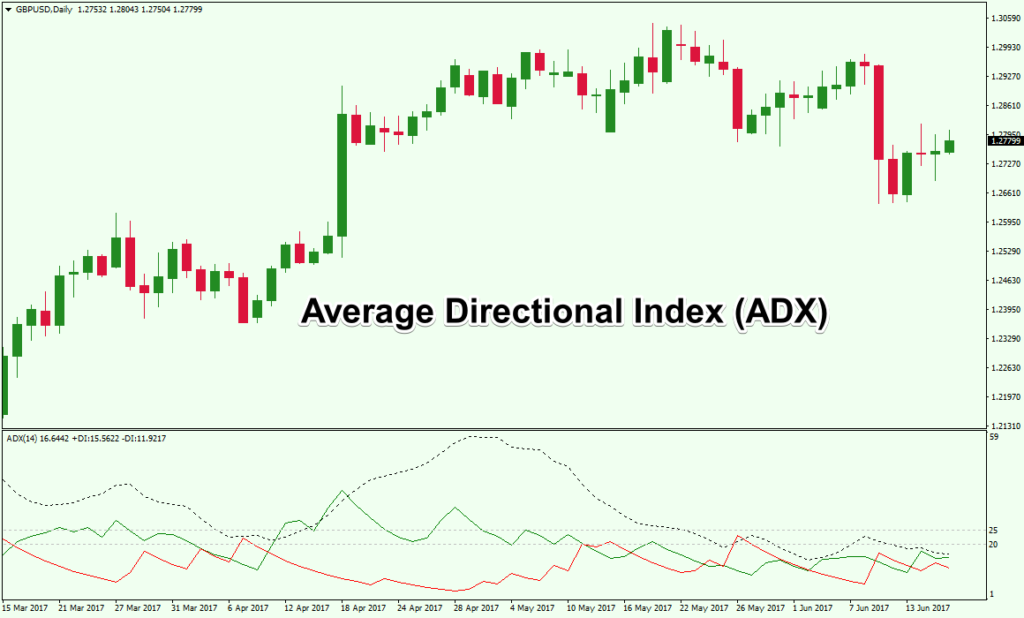
Figure 1: Average Directional Index (ADX) on MT4 Price Chart
As shown in figure 1, you can see that the forex adx indicator has the three lines. The dotted black line is the ADX line and this depicts the strength of the trend.
The adx trading rules are simple.
- When the ADX line is rising, it signals that the trend is moving strongly
- The green line is the +DI and the red line is the –DI. Positive or negative movement, or Up and Down trends are signaled by the crossovers of the +DI and –DI.
- When the red line is above the green line, it indicates a negative or a bearish trend. Conversely, when +DI is above –DI, or the green line is above the red line, it indicates a positive or a bullish trend.
Now that we have learned the basic elements of the average directional index indicator, we will now turn our focus on how the ADX DMI indicator is actually calculated.
ADX Indicator Settings Explained
Understanding how an indicator is calculated and the values plotted is important in building up to knowing how to actually use an indicator most effectively. Fortunately, today, traders don’t have to manually calculate the values as this is automated on all trading platforms.
Still, it is important to know what factors and values are considered by the ADX indicator when it fires off a signal.
The ADX calculation is based on first deriving the values from each of three components, the ADX line, +DI, and –DI. The +DI or positive is calculated by the current high of the price subtracted from the previous high, and should be greater than the value of the previous low, subtracted from the current low. In other words +DI rises when the difference between the current high and low is greater than the previous high and low.
The -DI or negative is calculated by subtracting the previous low against the current low and this should be greater than the current high subtracted from the prior high. When there is a negative value in either -DI or +DI, that value is entered as a zero or no change.
The Average Directional index or ADX line is based on the calculation of the true range, the +DI and -DI for each period, then smoothed. This is the input parameter for the ADX period. The typical default value of the ADX indicator is 14 period. So, this 14 period becomes the smoothing period for the ADX line.
When the ADX line crosses above the 20 or 25 thresholds from below, this suggest that the market is transitioning from a trendless market condition to a trending market condition. And so long as the ADX line stays above this level, it is an indication that the market is in a trending environment.
The values of 20 and 25 are applicable only for the ADX line and should be ignored for the +DI and –DI.
In Figure 2, we can see two areas where the trend strength indicator shows the strongest bearish and bullish short term trends.
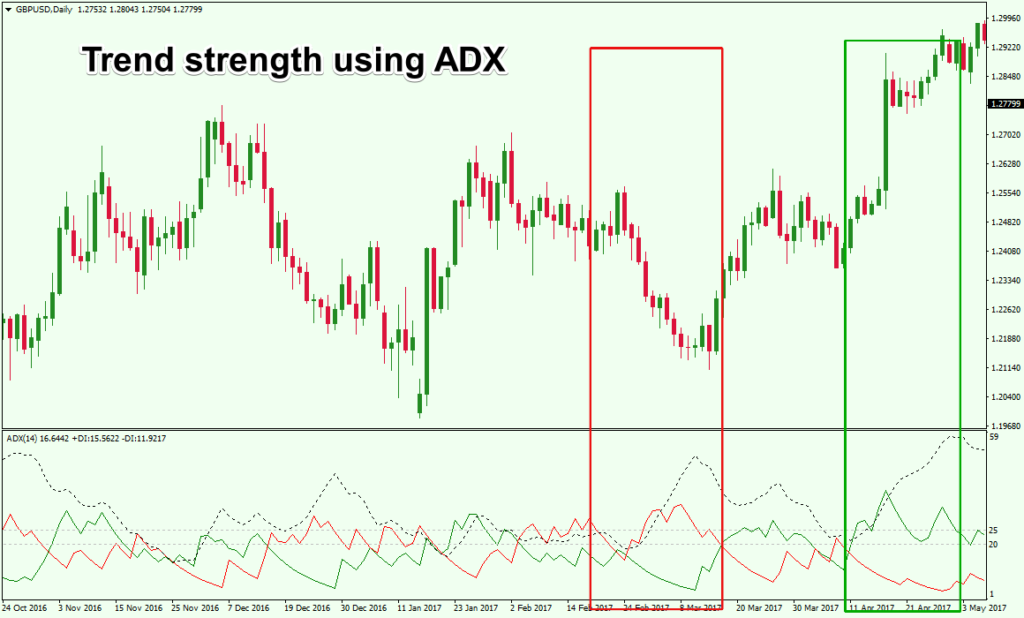
Figure 2: Determining trend strength using the ADX indicator
In Figure 2, the first region marked by the red area shows the bearish trend in play.
The ADX indicator depicts this bearish trend with the –DI above +DI suggesting a bear market is in place. The ADX line on the other hand rises sharply, indicating that the downtrend is strong. The ADX line initially bounces off 20 – 25 and then rises strongly.
In the next instance, marked by the green area, you can see that the +DI is rising or greater than the –DI. This suggests the uptrend in the price. The strength of the trend is also depicted by the rising ADX line which is above the 20 – 25 level and moves steadily higher.
The basic ADX trading rules state that trades can be initiated in the direction of the trend, as evidenced by the +DI / -DI reading, when the ADX line is rising and above the 20 or 25 level.
Another method is to make use of the crossover of the +DI and –DI lines on the ADX indicator to initiate and liquidate trades. However, caution needs to be taken with this crossover approach because, when the markets are choppy, the +DI and –DI can whipsaw repeatedly with bullish and bearish signals .
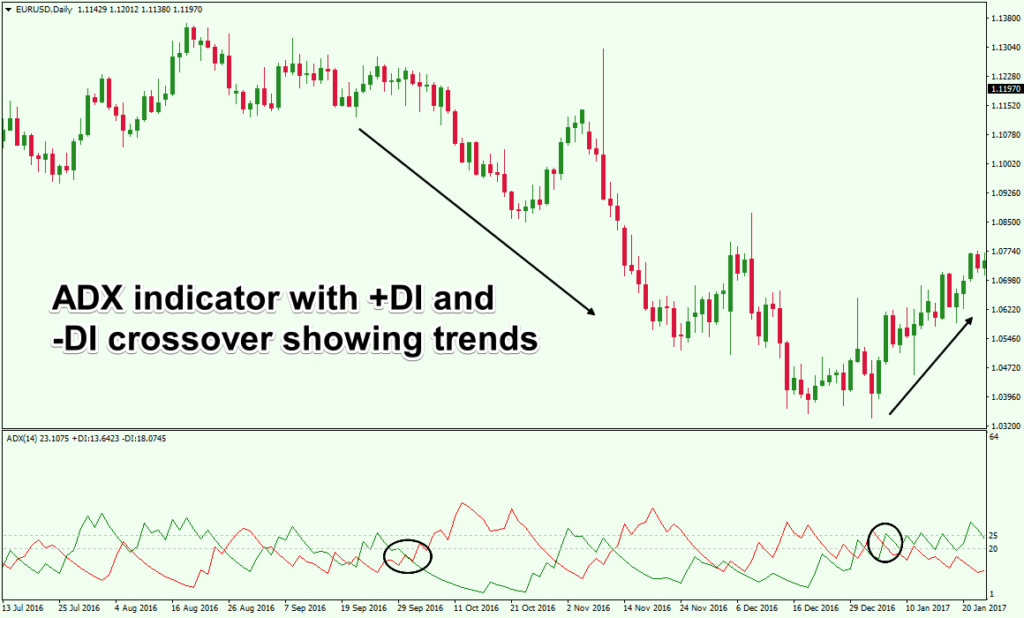
Figure 3: +DI and –DI crossover method
In figure 3, the chart illustrates an example of the bullish and the bearish trend in the market. In the first instance, the bearish trend in price is depicted by the rising –DI line and a falling +DI line. This bearish trend is also depicted by the crossover of the DI lines.
In the second instance, a bullish trend is shown. Here, the +DI is seen crossing over –DI line, depicting a bullish trend in the market.
These crossovers can be viewed in the same light as you would a dual moving average crossover signal. Note that in the above examples, the ADX line has been hidden, to depict only the DI crossovers.
In the next example shown below in figure 4, we can see that the ADX line can be used to determine the trend strength.
Here, the DI lines are hidden so we can focus our attention on the ADX line.
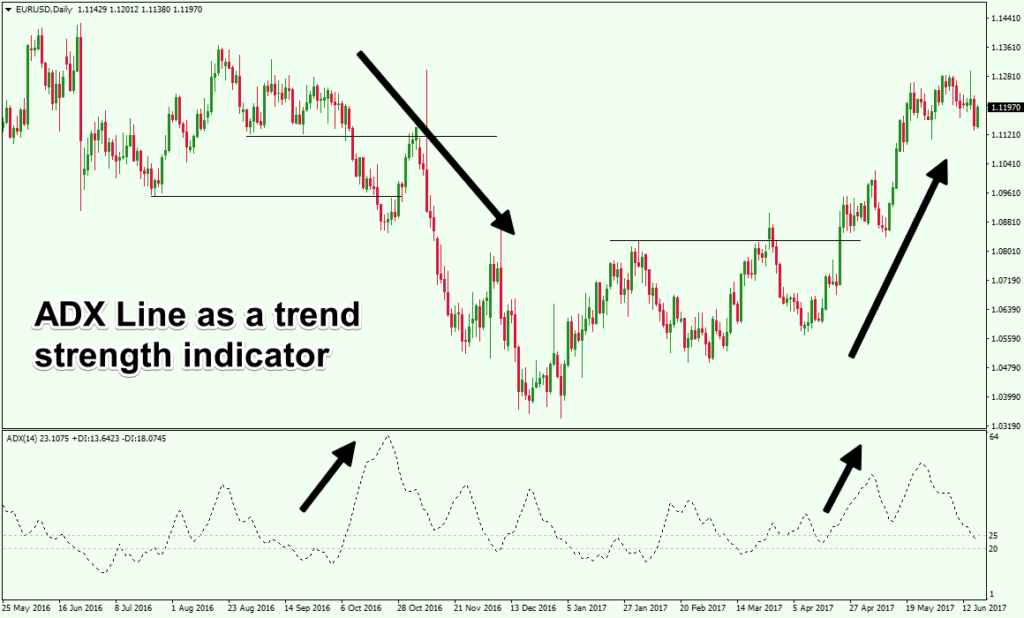
Figure 4: ADX Line to determine the trend strength
In the above chart example, we have identified important price levels marked by the horizontal lines. When price breaks below the appropriate support level, you can see that the strong bearish trend is validated by the rising ADX line.
In the next example to the right side, you can see how the resistance level was broken, which was validated by the rising ADX line above the 20 to 25 level.
Thus, the ADX can be used alongside a price action based method of analysis and trades can be initiated accordingly.
How to Build an ADX Trading System
Understanding the intricacies of the ADX indicator and its functions is essential to building an ADX based trading system. Many times, traders use redundant indicators that in turn provides a false sense of confirmation. For example, using two or more oscillators like the RSI, Williams %R, or Stochastics doesn’t provide much value, as each of these indicators are essentially measuring the same thing.
All these indicators more or less measure the momentum in price. Therefore, it is crucial to incorporate non redundant, non correlated technical tools into your trading approach for confirmation purposes.
There are many approaches to trading with the ADX indicator. Sometimes, you might want to make use of all three components, but other times, you may just use the ADX line to determine the trend strength and combine that with other methods to confirm trend direction.
Let’s take a look at some of the ways you can use the ADX study to develop a sound trading strategy.
We will look at combining the ADX indicator with a dual moving average crossover. In this trading approach, you would rely on the moving average signals for trend direction and the ADX line as a filter to initiate trades only when the trend is strong.
In figure 5, you will see the ADX line in the sub-window and the dual moving averages plotted on the price chart.
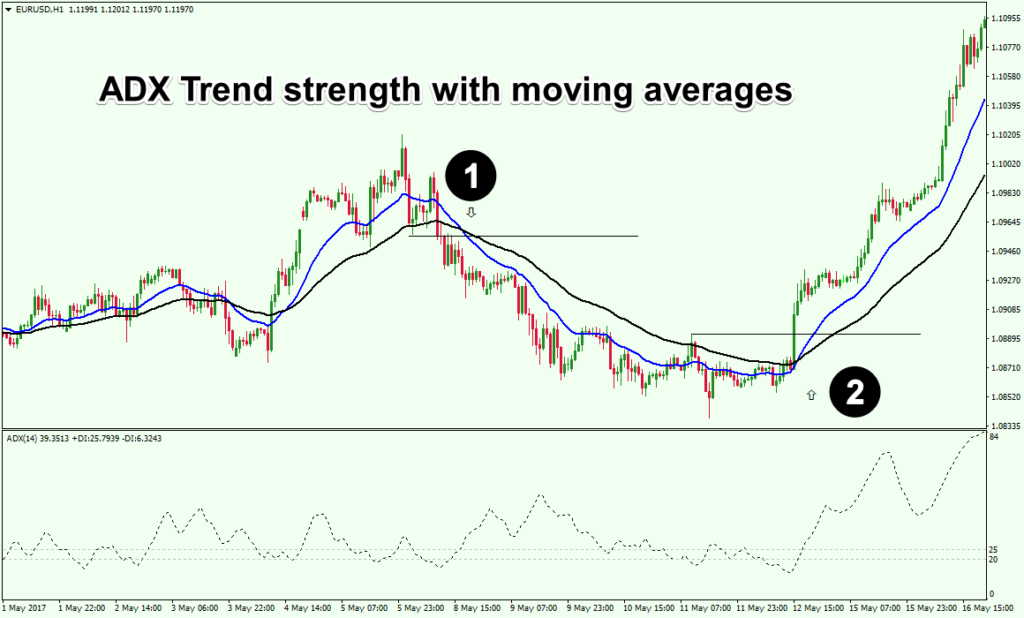
Figure 5: ADX line with dual moving averages
In the first instance, marked by 1, we can see that the trend has become bearish with the short-term moving average crossing below the long-term moving average.
You can see that the ADX line previously dipped below 20 and then started to rise to cross above the 20 – 25 level. This suggests that the ADX line is indicating a trending market condition. Looking at the recent highest low that was breached and the evidence for a new bearish trend, as suggested by the dual moving average crossover and ADX combination, we can confidently take a short position in the market.
In the second instance, marked by 2, we can see that the trend becomes bullish when the moving average crossover occurs to the upside. Similar to the first instance, the previous recent lowest high is breached just when the moving averages aligned to show a transition to a bullish market state. Here, the ADX line was already sloping up after falling to 20 – 25, indicating that the market is in a state of trendiness. Thus, the weight of evidence shows that a long position would be a favorable trade to take in this situation.
The ADX indicator can be used for both day trading, swing trading, and longer term position trading. However, the integrity of trends is always more reliable on higher timeframes, typically hourly and above at the bare minimum. Regardless, the average directional index indicator is a highly useful indicator that combines both trend direction and trend strength and should be considered by traders as an addition to their trading toolbox.