In today’s lesson, we will discuss a very simple but highly useful tool that can provide valuable information to the trader. The indicator I am referring to is called Average Daily Range (ADR), which provides data on a currency pair’s daily volatility. We will discuss how to use ADR to find hidden support and resistance areas on the chart, and how we can generate short term trade signals from these levels.
Average Daily Range of Currency Pairs
The Average Daily Range shows the average pip range of a Forex pair measured over a certain number of periods. Traders can use the ADR to visualize potential price action outside the average daily move. When ADR is above average, it means that the daily volatility is higher than usual, which implies that the currency pair may be extending beyond its norm.
The ADR can be helpful in setting targets for positions you are currently in as well. For example, if the ADR shows you that a Forex pair has an average daily range of 85 pips, then it might be wise to tighten up your target if a price move has achieved or is close to this expected range.
The ADR is also useful for trading intraday reversals. For example, if a currency pair reaches the top of a daily range, then it could be due for a reversal, and you could consider a mean reversion strategy to capture a potential retracement.
Average Daily Range Indicator
Before we dive into how we can use the ADR to trade, we should take a moment to understand the composition of the indicator. The indicator has a very simple and easy-to-understand formula, which will be discussing next.
How to Calculate ADR
The calculation of the daily range of a currency pair is a relatively easy process. You simply take the distance between the daily highs and daily lows of a currency pair. The technical indicator is fully customizable, and you can configure it to take into consideration as many periods as you want. Let’s see an example of how the ADR calculation works:
Say that we adjust our ADR indicator to take into consideration five days. The distances (range) between the highest and the lowest point of each of these days are:
- n1 = 56 pips
- n2 = 27 pips
- n3 = 78 pips
- n4 = 30 pips
- n5 = 42 pips
The ADR calculator formula is as follows:
ADR = (n1 + n2 + n3 + n4 + n5) / 5
And now we apply the values to the formula
ADR = (56 + 27 + 78 +30 + 42) / 5
ADR = 233 / 5
ADR = 46.6 (approx. 47)
The more periods you take into consideration, the more “n” values you will have and the higher the divisor in the formula will be. So, let’s say you take a 1-year period for your ADR. This would mean that you will have 260 “n” values in the formula, because there are 52 trading weeks in a year and five trading days in a week (52 x 5 = 260). This means that you will add 260 “n” values, which you will need to divide by 260.
Fortunately, you do not need to manually do this yourself, because the ADR indicator within your trading platform will perform this calculation. The only thing you are required to do is to select the period input you want the ADR to take into consideration.
Reading the ADR Indicator
The ADR indicator has a very simple output and in most cases, you will see an additional text with the output values on your chart after you apply the indicator. The ADR indicator should show you a number for the n-periods ADR value.
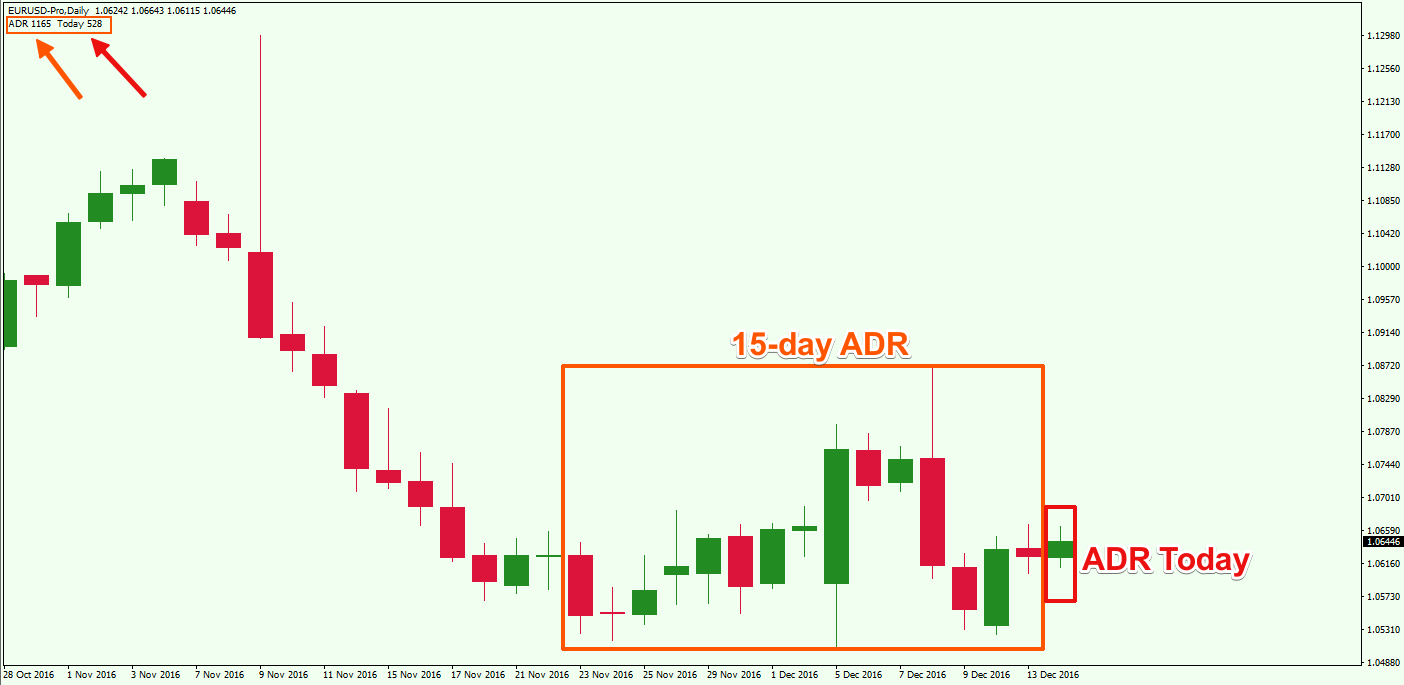
Above we have a daily chart of the EUR/USD Forex pair within the MT4 platform. We have attached the ADR indicator to the chart. Although you might not see the tool, it is right there at the top left corner of the chart. It has been marked with a small orange rectangle.
There are two values there. The first one shown with the orange arrow, is the 15-period ADR, and the second one shown with the red arrow is the today’s (last bar) ADR value.
The 15-day ADR shows the number as 1165. This value corresponds to 116.5 pips and today’s (current bar) ADR value shows 528, which corresponds to 52.8 pips. Keep in mind that based on your chart settings and particular ADR indicator, the manner in which you read the pip value may differ.
Back to our example, the average daily move of the EUR/USD for the last 15 days equals 116.5 pips. But for today the EUR/USD has only moved with 52.8. This means that the EUR/USD has been relatively quiet today thus far. This can be valuable information to the trader regardless of the strategy employed.
Building the ADR Range
To build the current ADR range, you need the current daily low and daily high. To find the upper and the lower level of the ADR range on the chart, you would need to apply the ADR value as follows:
- To build the upper ADR level, you would need to apply the ADR value upwards starting from the daily bottom.
- To build the lower ADR level, you would need to apply the ADR value downwards, starting from the daily top.
These two steps are shown in the image below.
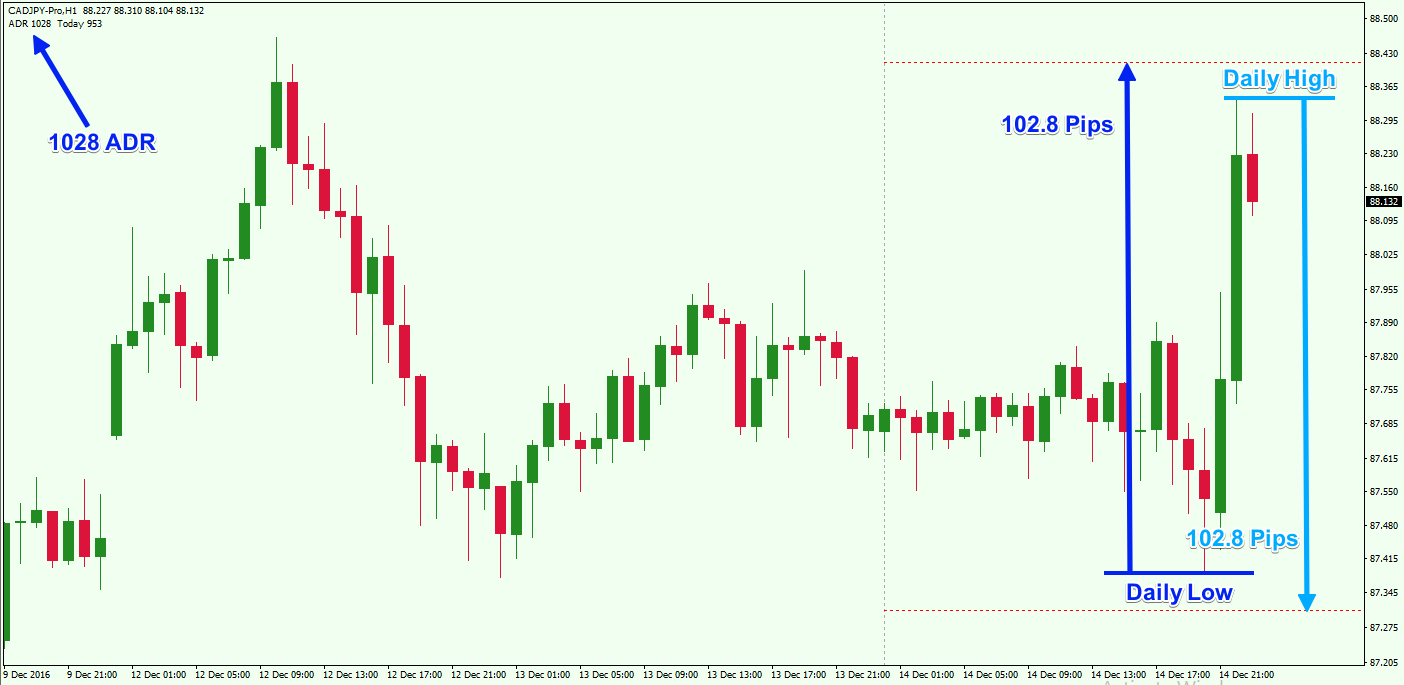
We have a 15-day ADR indicator on the chart above. The 15-period ADR value is 1028, which corresponds to 102.8 pips. When we apply the 102.8 pip distance starting from the daily high and the daily low, we get the two red dotted lines you see on the image.
In our case, we are using a more advanced ADR indicator, where the upper and the lower level of the range are plotted automatically. Depending on the ADR indicator you use, you may or may not have certain functions.
ADR Indicator for MT4
Unfortunately, the ADR indicator is not included in the default MT4 platform as of this writing. You will probably need to download and add the indicator manually to the platform if you are using Metatrader.
Before you can add an ADR Indicator to your chart within Metatrader, you would first need to find a version of the indicator online. You should be able to find one within the MQL4 community.
After you have located one that suits your requirement, you would need to download the .mql file of the indicator, and save it somewhere on your computer. Make sure you remember where you have saved the file, so you would be able to find it afterward.
Then you need to open your MetaTrader 4 platform. Go to File>Open Data Folder. You will see a standard folder window popping up on your screen. In the folder, you need to go to MQL>Indicators. This is where you will drop the .mql file of the Average Daily Range indicator.
After you do this, you will need to re-launch your MetaTrader4 terminal. When you open the platform, you will need to go to Insert>Indicators>Custom. You should be able to see the newly added ADR indicator there. Make sure to modify any preferences before you add it to your chart.
Trading Strategy Using the Forex Daily Range
After you have applied the ADR to your chart, you can utilize it in several different ways based on your personal trading style. We will take a look at an example of how the ADR can be applied as a trading strategy.
Enter an ADR Trade
We will consider two cases when the ADR indicator is useful for opening trades.
The first case is when the price action breaks through the upper, or the lower level of the daily range. In this case, you might want to open a trade in the direction of the breakout.
The second case is when the price action reaches the upper, or the lower level of the daily range, and bounces from it. In this case, you may consider a trade in the direction of the bounce.
Stop Loss on ADR Positions
Always use a stop loss order when trading with leveraged instruments. If you trade an ADR breakout, it will be best to use your price action knowledge to position your stop-loss in a logical place. The same is in force if the range breakout is bearish.
If the price action bounces from one of the ADR levels and you trade in the direction of the bounce, your stop-loss order should be placed beyond the swing created by the price bounce.
Take Profit with the ADR Indicator
The ADR indicator can be a useful guide and provide a better picture of the potential you have with your trade. For example, If the historical Average Daily Range of a Forex pair is 80 pips, and price action for the day has come close to reaching this range, then it would make sense to consider trailing your stop a bit closer on the assumption that the price move has likely reached it limit for the day.
Forex Average Daily Range Strategy Example
Now let’s look at an example ADR trading strategy. In the image below you will see a chart with the daily ADR indicator.
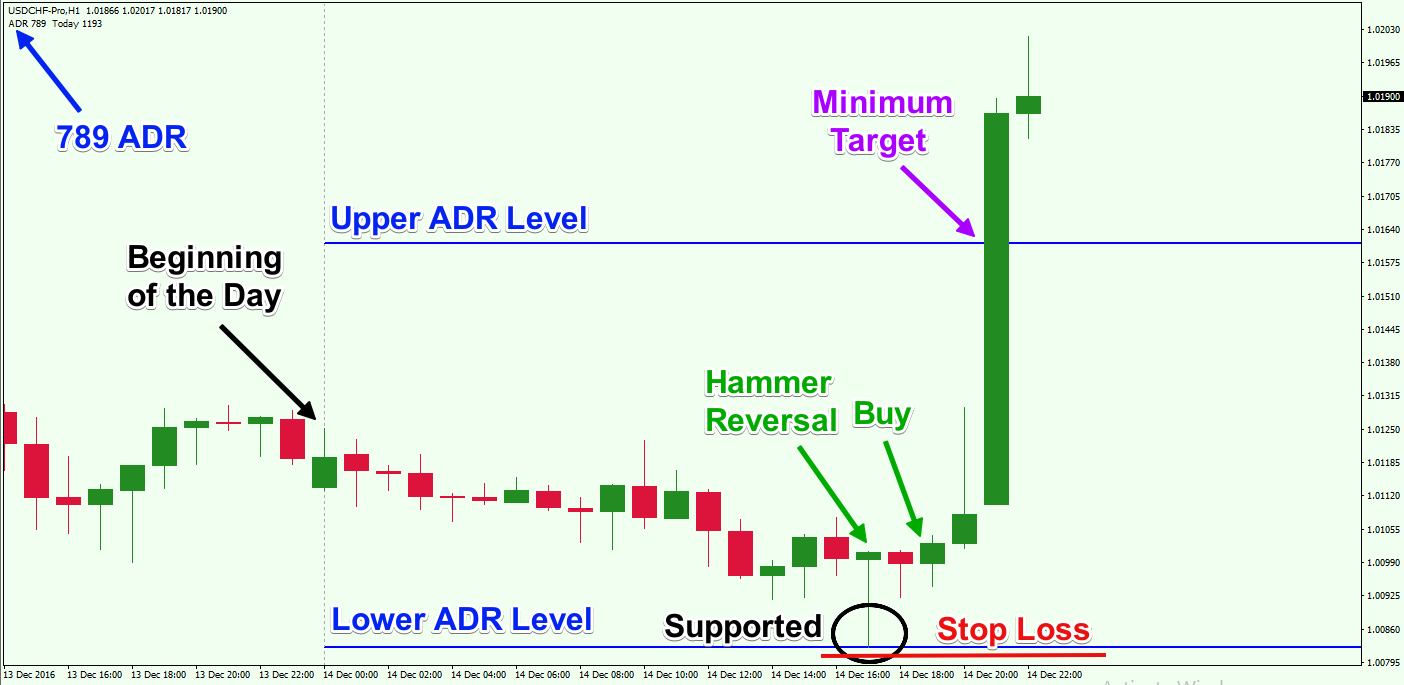
This is the H1 chart of the USD/CHF Forex pair for Dec 13 – 14, 2016. The image shows the ADR indicator values at the top left corner. The ADR is adjusted to take into consideration 15 days. The two blue horizontal lines are the upper and the lower level of the Average Daily Range. The ADR indicator we use here allows us to automatically plot the upper and the lower level of the ADR.
The black arrow points to the beginning of the trading day. As you see, the price action starts a gradual move toward the lower level of the daily range. Suddenly, the price approaches the lower level of the range and touches the level. A bullish bounce appears afterward.
Furthermore, a candle resembling a Hammer Reversal Candle or Pin Bar has formed. When a candle closes above the high of the Hammer, you could buy the USD/CHF on the assumption that the price is likely to increase based on the weight of evidence that we have been thus far.
At the same time, you would want to place a stop-loss order below the lower ADR level, from which the price bounces from. This is shown with the red horizontal line on the chart. Your trade is now protected.
The target for this trade is the upper ADR level. Therefore, you should hold the trade until the price reaches close to this level. When this happens, you have two options: to close the trade and take your profit or hold the trade in case a breakout occurs.
In this case, there was a breakout through the upper level of the ADR.
Trading Outside the Average Daily Range
Now let’s dissect another trading example using the ADR Indicator.
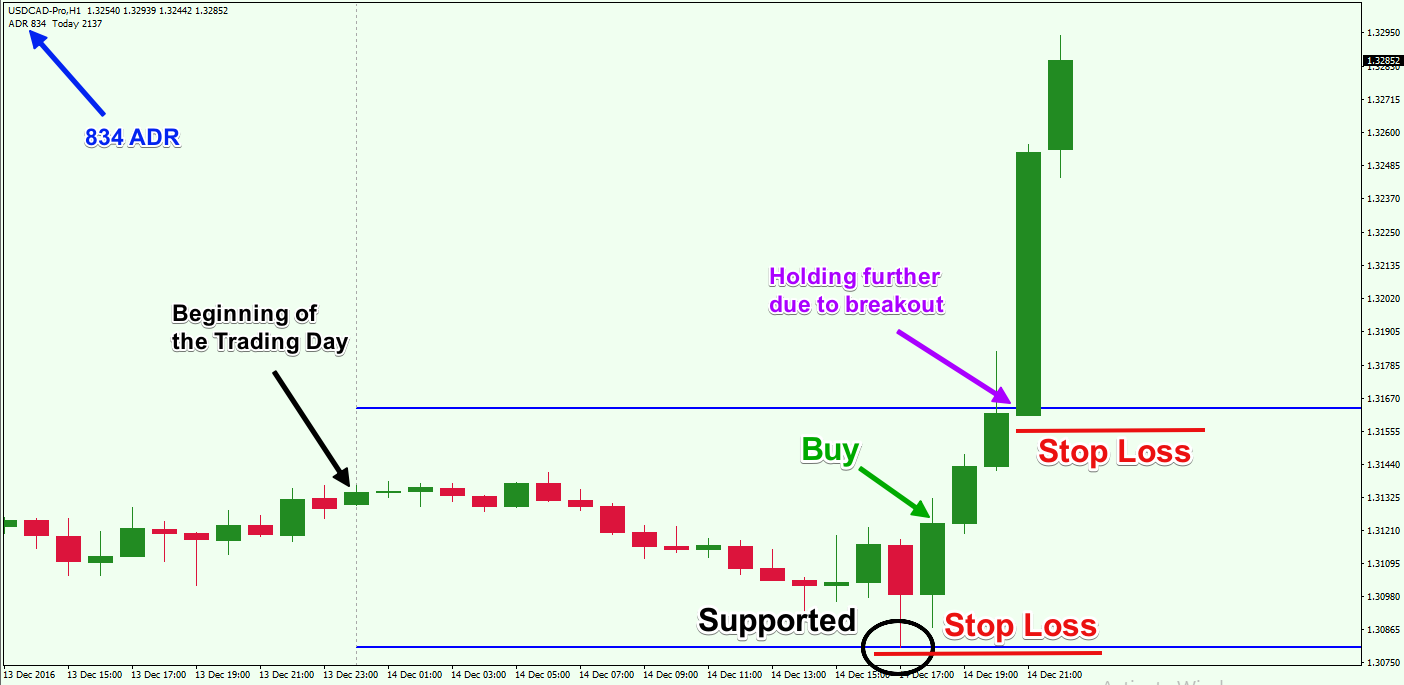
This time we have the H1 chart of the USD/CAD. The trading day starts with a slight price decrease where the price reaches the lower level of the ADR indicator. After touching the lower level of the ADR indicator, the price bounces in a bullish direction. The bounce at this ADR support zone implies that the area is likely to hold and we are probably witnessing a reversal. Therefore, you could buy the USD/CAD Forex pair on the assumption that price is likely to rise from this level.
You should also place a stop loss order below the lower level of the ADR. This way your trade will be protected from unexpected events.
As you can see, the price action increases afterward. The increase is relatively sharp. Soon thereafter, USD/CAD breaks through the upper level of the ADR indicator creating further bullish potential.
Based on the strong momentum breakout and continued momentum, you can hold the trade further on the assumption that the price action is currently entering a bigger trend.
But if you decide to stay in the trend for further gain, you should move your stop loss order. You should adjust the stop so that it is located below the upper level of the ADR. Also, take into consideration the last candle bottom which is located inside the ADR horizontal channel prior to the breakout, as we have done on the image above.
Then you should hold the trade at least until the end of the trading day, or until the price action reveals that the upswing could be nearing an end.
Conclusion
- The Average Daily Range is an indicator that shows the average pip range of a currency pair over a specific period of time.
- To calculate the ADR value, you need to:
- Get the daily high and low of every trading day for the specified period.
- Add the distance between each daily high and low, and divide that by the number of periods.
- The ADR indicator is a very simple and easy-to-use trading tool. Its output is just two values that are usually plotted on your chart:
- ADR over specific period
- Current Daily Range
- To build the range of the ADR indicator, you would need to apply the ADR value from the daily low (extending above) and from the daily high (extending below). This will provide the two levels of the ADR Range.
- To add the ADR indicator to your MetaTrader4 platform you need to implement these steps:
- Find the .mql file of the indicator you would like to use
- Download the ADR Indicator.
- Open MT4 and go to File>Open Data Folder.
- Go to MQL>Indicators and paste the downloaded .mql file.
- Restart your MT4 platform.
- Go to Insert>Indicators>Custom and choose the new ADR indicator.
- ADR Trading Strategy:
- Enter a trade when the price action breaks the ADR range and enter in the direction of the breakout. Also, enter a trade when the price action bounces from one of the ADR levels. In this case, you enter in the direction of the bounce.
- If you trade a breakout, put a stop beyond the broken level. If you trade a bounce, put a stop beyond the created swing level, from which the price action bounces from.
- If you are trading a breakout, stay in the trade at least until the end of the trading session, or until price action provides contrary signals. If you are trading a bounce, try to stay in the trade until the price action reaches the opposite ADR level, or until the end of the trading day.