 The concept of the balance of trade is bounced around a lot in the trading community, but it is often misunderstood to some degree. In this article, we are going to take a deep dive into understanding exactly how the balance of trade works and how a trader can utilize the U.S Trade Balance report to make informed trading decisions.
What is the Balance of Trade?
The balance of trade (BOT) is an economic indicator that measures a country’s net exports, i.e. the difference between a country’s imports and exports for a specific period of time. The balance of trade usually has the largest share of a country’s balance of payments (BoP).
Countries have the incentive to achieve a positive balance of trade, which means they export more than they import. The opposite situation, where a country exports less than it imports, has a negative trade balance as result. A positive trade balance is also called a trade surplus, while a negative trade balance is called a trade deficit.
A country’s balance of trade doesn’t consist only of exports and imports of goods. Other components include foreign aid, domestic spending and investments abroad. By subtracting the components that increase the balance of trade from components that decrease it, analysts arrive at the true trade surplus or trade deficit for a country.
How is the US Balance of Trade report published?
The US balance of trade is released monthly by the Bureau of Economic Analysis, about 5 weeks after the reporting month ends. In their publication titled “U.S. International Trade in Goods and Services”, the BEA gives detailed reports about the monthly imports and exports of goods and services, the trade deficits or surpluses both in absolute and relative figures, as well as the balance of trade per category of goods and services. Other popular reports include the quarterly released “U.S. International Transactions” and “U.S. International Investment Position”. The US trade balance economic release, as well as other reports of the Bureau of Economic Analysis can be found on their website.
Understanding the Fundamentals behind the Balance of Trade
A popular currency valuation model based on the Balance of Payments, of which the balance of trade is a part of, is the balance of payments approach. This traditional currency valuation model suggests that changes in national income affect both the current and the capital account, and causes a predictable reaction of the exchange rate in order to restore the balance of payments equilibrium. In this part of the article, we will examine the transmission mechanism from the change in national income through to the currency reaction.
First, let’s introduce the well-known identity for economic adjustment:
S – I = Y – E = X – M
Where:
S = Savings
I = Investment
Y = Income
E = Expenditure
X = Exports
M = Imports
Under a floating exchange rate regime like the US dollar, traders should be aware of both the capital account and current account (which includes the balance of trade). In this case, as national income rises, so import demand rises, causing the current account (balance of trade) to deteriorate.
Now, the exchange rate acts as a transmission mechanism to restore the balance of payments imbalance. A rise in national income, which caused the current account deterioration, must be followed by a rise in real interest rates which will dampen import demand, causing the current account deterioration to reverse.
 The Current Account Balance and the Exchange Rate
The current account balance can be used to forecast the long-term equilibrium exchange rate.
Under this model, the equilibrium exchange rate is that which creates a current account balance in the long run, consisting of the balance of trade. The trade balance of a country can affect exchange rates in several ways.
First, an external or trade imbalance can influence the flow supply and demand of currencies, and this way directly influence the exchange rates.
If the current account (balance of trade) is showing a high trade deficit relative to historic levels, the real exchange rate has to depreciate to restore the current account equilibrium. Similarly, if the current account shows a high surplus, the real exchange rate has to appreciate to restore equilibrium.
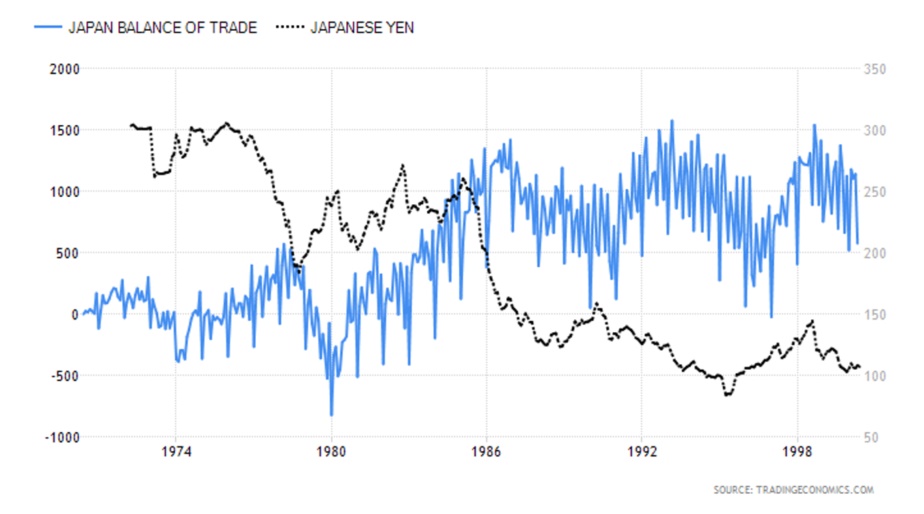
A good example regarding the current account surplus and the exchange rate reaction, is that of Japan and its large trade surplus with the United States. The country has generated an extremely high trade surplus with the United States from the seventies to the nineties, which required a substantial real exchange rate appreciation of the yen to restore the current account balance. Indeed, the dollar/yen exchange rate hit a record level of 79.85 by the end of the mentioned period. The following chart shows the relationship between the Japanese balance of trade and the Yen during that period.
 Second, an external imbalance can shift financial wealth from deficit countries to surplus countries, which can lead to a shift in global asset preferences. This in turn can affect the equilibrium exchange rates of currencies involved. Large external imbalances can alter the market’s perception of what exchange rate constitutes a currency’s real long-term equilibrium level. A steady rise of a country’s trade deficit and external debt levels will cause downward revisions in the perception of the long-term equilibrium exchange rate for a currency.
“Terms of Trade” and why it matters
When tracking a country’s current account balance for the sake of exchange rate forecasting, traders should also be aware of the “terms of trade” of a particular economy. The “terms of trade” of a country is simply the relationship between its export and import prices, and can give a valuable insight into the future real exchange rate. If a country’s terms of trade improve, in that its export prices rise relative to its import prices, this can lead to a positive trade surplus which in turn causes the real exchange rate to appreciate to restore equilibrium. Similarly, a deterioration of a country’s terms of trade leads to a current account deterioration, which in turn requires a real exchange rate depreciation to restore equilibrium.
This is especially true for major commodity exporters and importers. For example, a rise of the price of oil will have a significant impact on the currencies of major oil exporters, and importers alike. Major oil exporters, like the countries of the Gulf, USA, Russia, UK and Norway will experience an improvement in their terms of trade with oil prices rising, which leads to an improvement in their current account and trade balance figures as well. This will create upward pressure on their equilibrium exchange rates. The opposite is true for major oil importers, they will experience a deterioration in both their terms of trade and current account/balance of trade. These circumstances will of necessity lead to a depreciation of their currencies in order to restore the balance of payments.
The Specifics of the US Dollar and the Balance of Trade
The degree to which the US dollar will adjust to current account imbalances largely depends on the elasticities of the supply and demand curves, as well as the nature of which the current account imbalance arises. Let’s explain both concepts in the following part of the article.
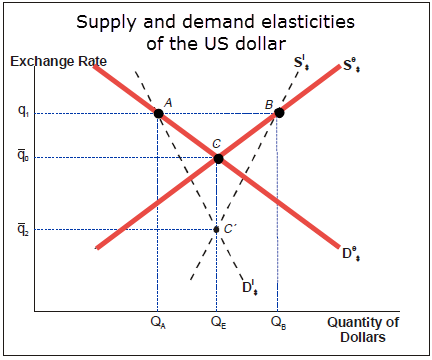
The following chart shows two pairs of supply and demand curves for the US dollar, De$ and Se$ represent highly elastic curves, while DI$ and SI$ represent highly inelastic curves. Let’s assume that q1 is the present US dollar exchange rate. The distance between points A and B is the assumed US trade deficit.
In order to restore equilibrium, the US dollar needs to depreciate to points where the supply and demand curves intersect, i.e. C or C’ in case of the highly inelastic supply and demand curves.
The elasticities of US exports and imports are estimated to be quite small, equaling to around -1.0 for exports and -0.3 for imports. Based on these low elasticities, the exchange rate adjustment of the US dollar needed to restore a current account balance would be rather large. Therefore, the inelastic supply and demand curves on the chart represent fairly the large degree to which the US dollar needs to depreciate to restore current account balance, with the new exchange rate at the point q2.
The nature of the current account deterioration also affects the path which the exchange rate will take. In fact, a current account deficit can also lead to an exchange rate appreciation. Evidence of this can again be found in the US dollar, which appreciated dramatically over the 1995-2001 period despite a record high current account deficit.
A current account imbalance can occur not only by changes in value of exports and imports, but also by shifts in national savings and investments, as the identity for economic adjustment in the first part of this article shows. Indeed, the balance of trade can deteriorate and still cause an appreciation of the exchange rate. That’s why traders need to be aware of the bigger fundamental picture of a specific currency when trading the balance of trade report. In the long-term, fundamentals are the main driver of any currency, but technical analysis should be used to confirm the research of the fundamentals and provide market timing clues.
If a country underwent a major investment boom or undertook a long-term policy of fiscal expansion, both of these actions will cause an exchange rate appreciation despite a widening current account deficit. An increase in investments over national savings results in a widening current account deficit, and simultaneously creates upward pressure for the domestic currency. This is what happened to the US dollar over the 1995-2001 period, when US domestic investments exceeded savings to a large degree.
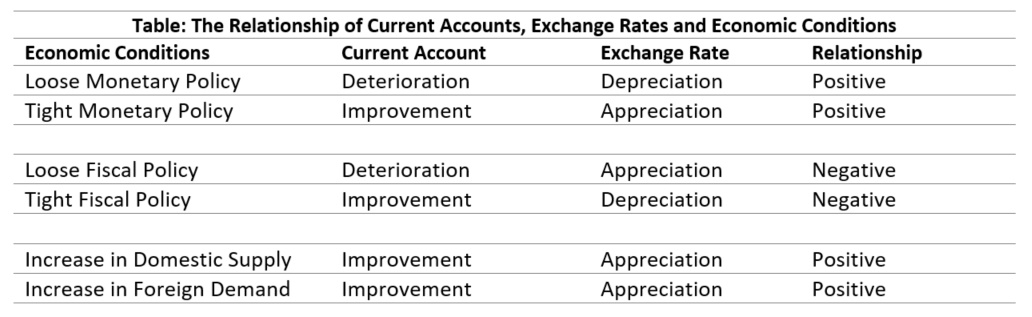
Specific changes in the economic adjustment identity can cause the exchange rate and the current account imbalance to move in the same direction, like the balance of trade deterioration leads to a weakening currency for example. Other disturbances can cause the exchange rate to move in the opposite direction than the balance of trade would suggest. The relationship among various economic conditions and their linkage to the current account and exchange rate are shown in the following table.
A popular method used to boost exports and lower the trade deficit is to intentionally devalue a currency, for example through monetary easing. In case of the USD, this would likely create significant problems. As the recent labor data has showed, as of this writing, that there is a possibility that the United States is approaching a full employment level. Weakening the currency to boost exports under such circumstances, would shift the US output past its full employment potential and create inflationary pressure. This in turn would require the Fed to tighten monetary policy, causing the US dollar to appreciate again.
How is the US Balance of Trade Performing?
As we have already mentioned, the balance of trade measures the difference between all exports and imports of a country. This comes with a lot of political strife as it is shown as an indicator that either violates or agrees with certain ideologies.
Many will defend the idea of a free market regardless of the balance of trade, but others will argue for subsidies, tariffs, or quotas in order to lessen the balance of trade deficit.
The US trade balance in 2016 achieved a deficit $481 billion. Imports in the US totaled $2.7 trillion, whereas exports only totaled $2.2 trillion. This is an increase in the total trade deficit of around $18 billion compared to the $463 billion trade deficit of 2015, and represents around 2.6% of the US GDP.
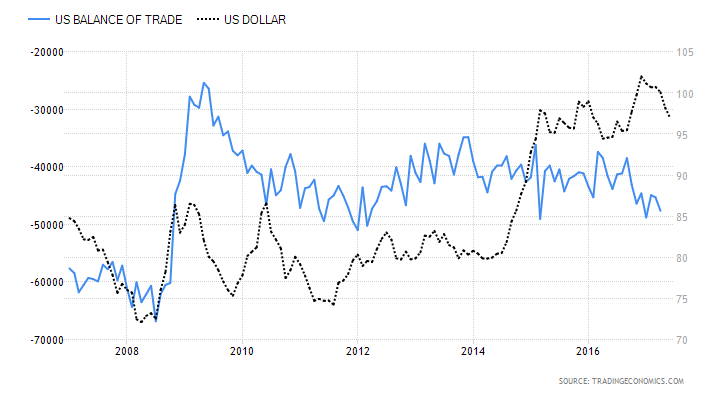
In the recent period, as the US trade balance report shows a widening deficit, the US dollar tends to weaken. This inverse relationship can be noticed in the 2008-2016 period, and is shown on the following chart.
Two things that should be kept top of mind with the BoT is whether it includes goods and services, as well as what the deficit or surplus is relative to the country’s GDP. Additionally, the proportion of the deficit matters and is often quoted out of context. There is a huge difference between the USA having a $500 billion deficit and other countries with relatively high deficits but comparably low GDPs, which is why GDP should always be factored in.
Conclusion
When discussing the balance of trade, there are varied opinions on the topic. But it isn’t necessarily better to have a trade surplus rather than a trade deficit. When a country is exporting more than it imports, that means that there is high demand for their goods and services, but at the same time it is probably due to their currency being cheap relative to other currencies. A good example is China and its record-high trade surplus with the United States, which partly arises from the Chinese Renminbi being intentionally undervalued by the Chinese government to boost export competitiveness.
Alternatively, having a trade deficit could just mean that a country’s currency has appreciated to the point where it is economically viable to import more due to the relative cheapness of goods and services from other countries.
The current US policy seems to be leaning towards more protectionist policies that will prevent continued importing of foreign goods, which overlooks the benefits of globalization and free trade. The inability to import cheap goods means that domestic consumers are paying more for them. At the same time, foreign producers are unable to sell their goods due to more restrictive policies.
Traders should always be looking to broaden their analysis to get a reliable measure of how a country is doing, and the US Trade Balance is one component of that. Learning the fundamental aspects of the market can help you gain a deeper understanding of the primary factors that drive currency prices, and allow you to place high-probability trades based on sound and reliable analysis.