The Service and Manufacturing sectors comprise the majority percentage of US GDP. As such it is important to gauge the overall health of these components. One of the most useful sentiment studies that can help traders and investors to forecast future economic trends is the ISM PMI Manufacturing report, and the ISM Non-Manufacturing report. We will discuss both of these key economic releases in this article.
What is the ISM Non-Manufacturing Report ?
The Non Manufacturing Purchasing Managers Index (PMI) is released by the Institute of Supply Management (ISM). The Institute was founded in 1915, and was the first supply management institute in the world. The report on business is a composite index that helps measure the economic health of the US economy.
Though the Manufacturing PMI has been around for much longer, there was a need to measure the economic situation within the service sector as well. This is especially true since the service sector is attributed a majority percentage of US GDP in real terms As such the ISM Non-Manufacturing report was born. This report has been published by ISM starting in 1998.
The data is compiled from surveys of approximately 400 purchasing managers in over 65 various non-manufacturing industries including mining, agriculture transportation, retail, and more. The report is released on a monthly basis on the third day of each month and reflects the data for the previous month. The Non Manufacturing Composite Index (NMI) is based on four equally weighted indicators: New Orders, Business Activity, Employment, and Supplier Delivery. All of these indicators are seasonally adjusted expect for the Supplier deliveries.
Generally speaking, when the index is over 50, it demonstrates that the economy is growing, while an index of less than 50 signals a contracting economy. In addition, a better than expected reading is usually bullish for the US Dollar, and conversely a lower than anticipated reading is usually bearish for the US Dollar. Positive readings over time will also tend to help boost stock prices.
Typically, the ISM Non-Manufacturing Index has a somewhat diminished market impact compared to the Manufacturing PMI release. One reason for this is that the non-manufacturing sector is generally much less volatile and more foreseeable than its US Manufacturing Index counterpart.
What is the ISM PMI Manufacturing Index ?
In the previous section, we discussed the ISM Non Manufacturing report, and in this section, we will talk about the ISM PMI Manufacturing economic release. It measures the manufacturing output for a particular time horizon. The ISM PMI Manufacturing report is released every month, on the first business day of the month. The data reflects the prior month’s activity.
The manufacturing sector is an integral component of the overall economic health of a country. Although the manufacturing sector of the US economy is less than 15% of total GDP, it is nevertheless an important economic report and often highly watched by many Forex traders.
The report is produced by ISM and is a diffusion index, which basically means that it has various components that comprise the index. The resulting number is then updated to take into account seasonality factors. The PMI Index composite takes into account the following indicators: New Orders, Employment, Supplier Deliveries, and Inventories.
The ISM Manufacturing report is gathered by surveying over 400 Purchasing and Supply managers about their future expectations on production, inventories, employment, and new customer orders. The benchmark number is 50 for the index. So, if the number is higher than 50 then this hints of economic growth, while a reading of 50 or lower is considered to be contractionary.
The ISM PMI index is considered to be a leading indicator. It helps foretell future spending and expenditures that contribute to economic expansion. The indicator tends to reflect changes before the economy does. If there is an uptick in the PMI index, meaning there is more manufacturing output, then this is likely to lead to stronger economic considerations. And contrary to this, if there is a downtick in the PMI manufacturing index, meaning there is less manufacturing output, then this is likely to lead to weaker economic conditions.
Significance of the ISM reports
The ISM Non-Manufacturing Index is a fairly new indicator compared to the ISM Manufacturing Index. However, it is becoming increasing important as the service sector takes up a larger and larger portion of US GDP. In fact, the service sector is the fastest growing component of the US economy.
Between both of these reports, a trader or investor can get important sentiment data covering all industries that account for more than 90% of overall GDP in the United States. These reports are released during the first few days of the month, and as such they can sometimes set a tone for the markets for the rest of the month. In addition, these reports can provide clues into the Non-Farm Payroll report that is released on the first Friday of every month.
The Non Manufacturing ISM Index can trend in one direction or another for many months, and this can provide valuable long term information on the state of the service sector. One of the major benefits in evaluating the ISM report is that the data provides valuable insight on a national basis rather than on a regional level. Some of the local purchasing managers’ surveys include the Philadelphia Fed report, the Empire State Manufacturing Report, and the Chicago Purchasing Managers Index.
There are some downsides that traders and investors need to be aware of with the ISM reports. As we have mentioned earlier, these reports are comprised from surveys. As such, the data can sometimes be quite subjective rather than based on empirical statistics.
For example, Purchasing managers being surveyed could be overly influenced by a host of factors including recent orders, internal company meetings, or their own pre-set biases.
Those looking for long term data will find that the Non-Manufacturing Index data only goes back to 1998. This, however, is not the case for the Manufacturing Index which can be tracked back to 1948.
Dissecting the ISM Report
As we have learned thus far, the ISM Purchasing Manager reports for both the Manufacturing and Non-Manufacturing sectors can be seen as a barometer for the US economy and tends to be a leading indicator for future economic growth. So, if Purchasing managers are optimistic and reporting upticks in spending, then traders can assume the possibility of better corporate earnings going forward.
Let’s now take a deeper dive into the report:
Below you see the “Non-Manufacturing Survey Results at a Glance” portion of the ISM Non Manufacturing Report on business for the June 5, 2018 release date. The full report can be found here:
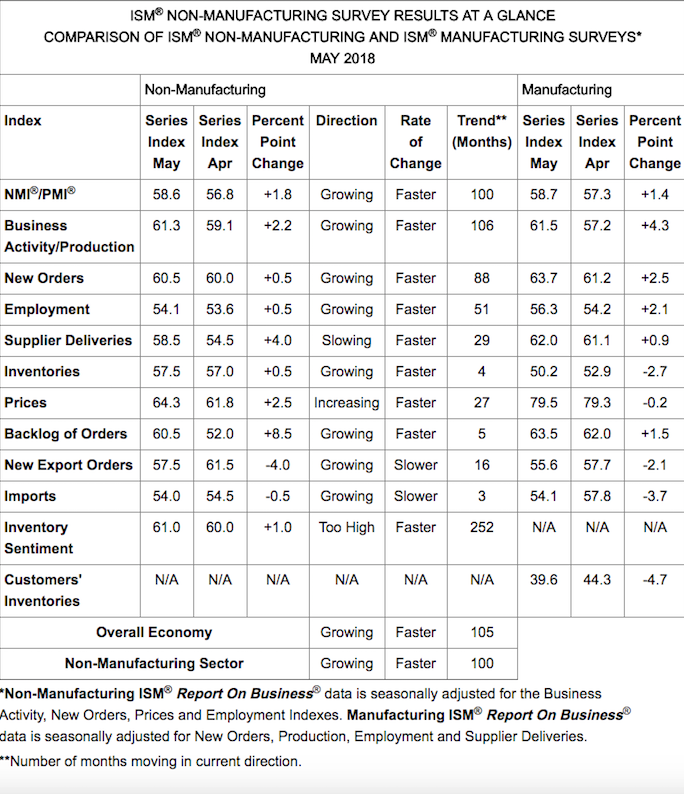
The beginning of the release posts the all-important headline number, the NMI PMI which in this example is 58.6. This is the number that the market is anticipating. Day traders will try to position themselves for potential short term price spikes based on this figure. As we have touched upon earlier, the NMI is a composite index based on four primary indicators: Business Activity, New Orders, Employment, and Supplier Deliveries. You will notice each of these components listed separately below the NMI PMI figure.
We also see the prior months Index figure and the Percent Point change between the two months. The Direction and rate of change column provides quick insight into the state of the economy based on these figures. For example, 58.6 is the most current figure and that forecasts a faster than normal growing economy.
On the far right of the column you will find details on the ISM Manufacturing numbers as well. This is useful in comparing the two component reports. For example, the Manufacturing PMI data for the month was recorded to be 58.7, and that was an increase from 57.3 from the previous month. At the same time, the percent point increase in the Manufacturing Index (+1.4) is lagging behind the Percent point change for the Non Manufacturing sector (+1.8).
There are many different way to read into and analyze these figures. but at the bare minimum, a trader should be familiar with the headline number and be able to quickly compare it to the previous month’s figure.
Trading the ISM Numbers
As we have learned in the earlier section, an ISM composite index number above 50 indicates that the US economy is expanding. In addition, when the number has been above the 50 baseline for several months, it tells us that the economy is stable and strong.
Conversely, when the number is below 50 it indicates that the US economy is contracting. And a number that has been below the 50 baseline for several months, can warn us of a potential recession.
Aside from the longer term forecast that we can make using the ISM figures, short term traders, can take advantage of the ISM economic release for short term price movements. One of the more popular types of news trading methodologies using the ISM report is to trade a divergence between expected results and the actual figure that came in.
For example, if economists are expecting a reading over 55 and the actual index composite comes in at 52 or 53, then the market may react to this discrepancy after the release. In this case, fundamental news traders would likely expect the lower than expected figure to be bearish for the Dollar, and a day trading opportunity could exist to ride the short term momentum on a weakening Dollar.
You could sell the USD/JPY pair for example, or buy the EUR/USD pair for a short term day trade or scalp. However, this trading idea is a generalization and traders need to keep in mind other news events and/or technical levels that could override the ISM reading.
Take a look at the chart below which shows the price action after the Mar 1, 2018 Manufacturing PMI report:
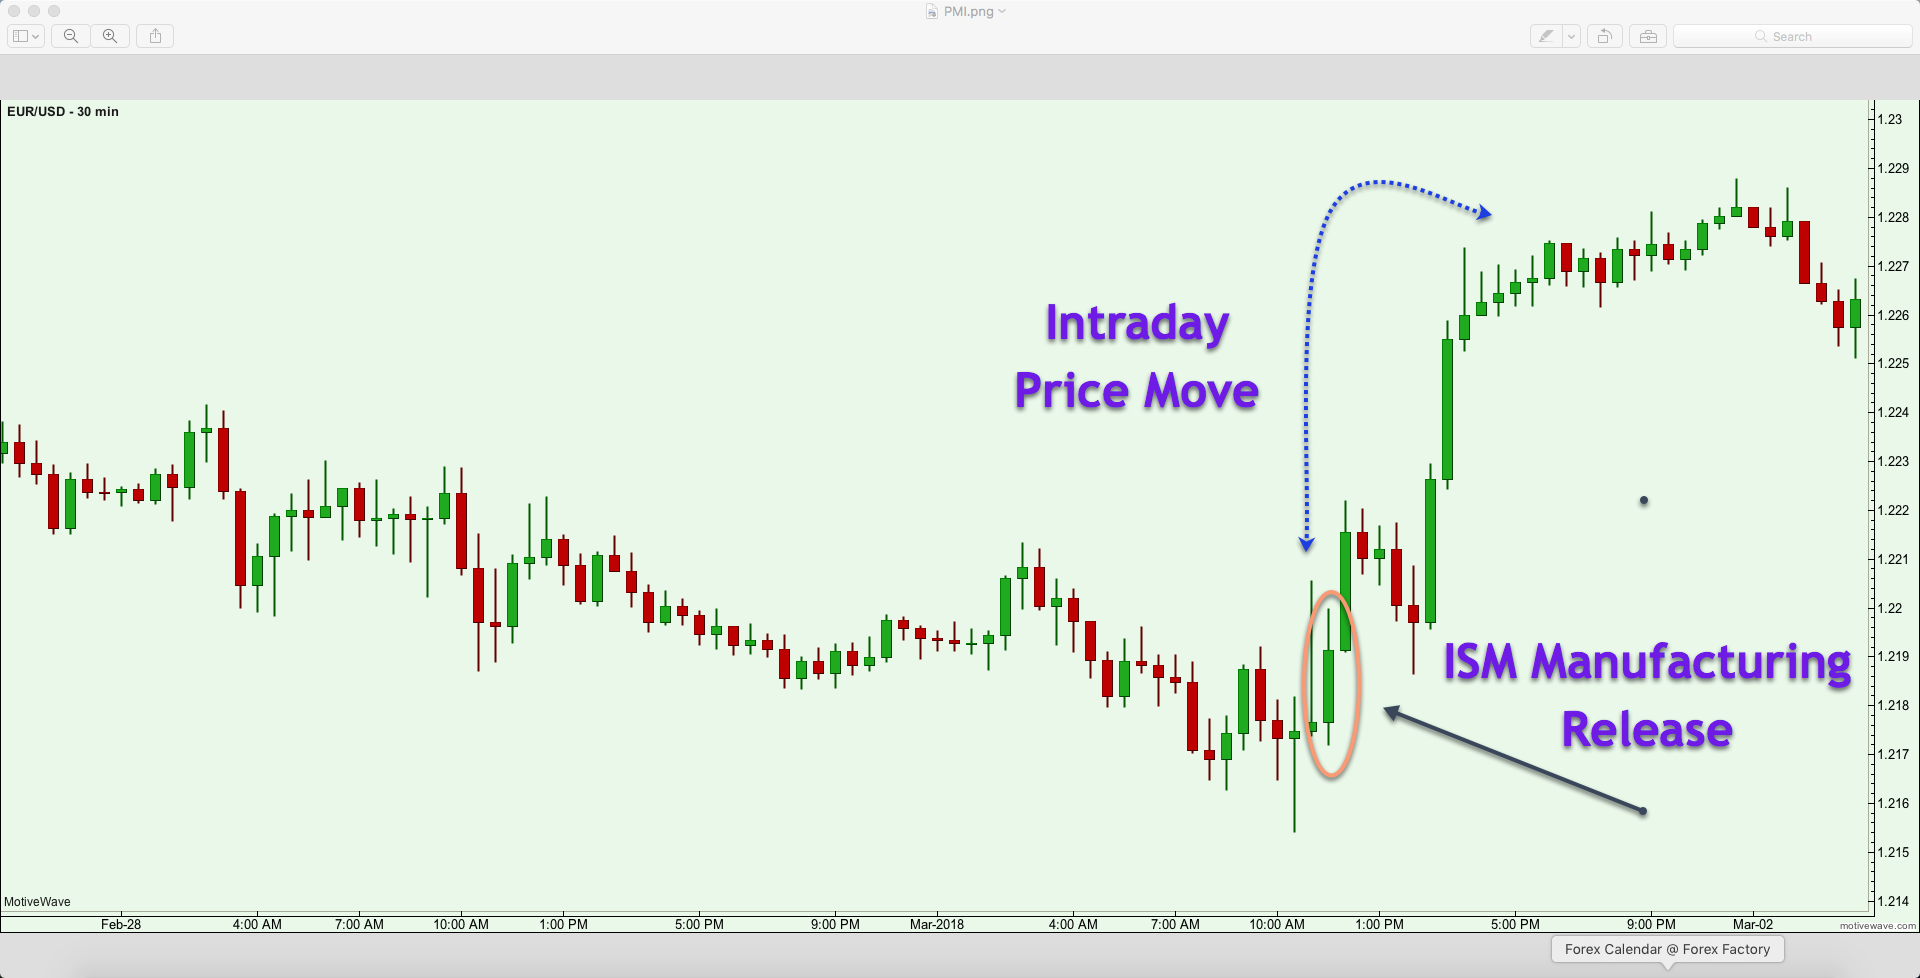
This is the 30-minute EUR/USD chart leading upto the March 1, 2018 Manufacturing PMI release. The Index came in at 60.8 and was higher than expected. The economists’ forecast was for 58.7. In addition, it was higher than the previous month’s number of 59.1. Both of these would have likely contributed to an expectation for a strong dollar rally for the day. But things are not always as they seem in the forex markets.
As you can see, the price action leading up to the ISM Manufacturing report was quite choppy and moving sluggishly to the downside.
Just after the ISM Manufacturing release, the price moved higher and closed the 30 minute bar decidedly bullish. The next 30 minutes shows additional strength and the bullish price movement continued for several more hours.
Before long the EURUSD pair was up over 100 pips. But we were expecting the Dollar to rise based on the strong ISM figures? Instead the Dollar fell sharply to the Euro on this better than expected news. Why is that?
Well if we dig a little deeper we can see that from the technical standpoint we had a bullish hammer candle formation near a major support zone in the EURUSD.
And at the same time that the ISM PMI economic report was released, we had another important fundamental event occurring. Fed chairman Powell was testifying before the Senate Banking committee.
Both these factors diluted the positive ISM report and caused the Dollar to fall sharply on the day. So, the point is that, regardless of how good an economic release appears, we must always be cognizant of other factors that can influence our position so that we can take that information into consideration as well.
Conclusion
The ISM PMI Manufacturing and Non-Manufacturing releases are anticipated by market participants, and can help a trader understand the underlying economic conditions and trends that exist. We have looked at the important components that comprise the reports and how investors can read the actual report.
We have discussed some advantages that the ISM release offers to traders, and a few drawbacks as well. The major drawback of the report is that is a fairly subjective rather than being highly data driven. This can lead to erroneous assessments at times.
Finally, we have demonstrated that the releases can be used by traders for short term opportunities, but that caution needs to be applied because relying solely on the release numbers without taking the overall market content or other factors into your decision process can lead to unanticipated consequences.