Analyzing price action is an integral component of technical analysis. Price action analysis can help traders select optimal trade candidates as well as assist in setting entry and exit points on the chart. Many traders are able to select their entry points without much issue but it is usually the management of exits that causes traders the most amount of grief.
In this article, we will take a close look at a specific pattern called the measured move, which allows the trader to confidently place a take profit target. It is a set it and forget type of trade setup that doesn’t require much in terms of trade management when the prescribed take profit rules are followed.
Measured Move Pattern in Technical Analysis
The Measured Move is a three-wave chart pattern that corrects a previous trend and acts as a continuation to a recently established impulse. That may sound a bit confusing but it will become clearer to you once you understand each component of the pattern.
The first wave of the Measured Move pattern acts as a reversal to the current trend. After the first wave develops, a second wave acts as a correction or a consolidation to the first wave. Then, after the second wave is finished, a third wave forms on the chart. The third wave is the one that we are waiting for to initiate our position. The third wave will resume in the direction of the first wave, and the target for the third wave is equal to the length of the first wave.
Elliott wave traders may recognize this as an A-B-C pattern, and Harmonic traders may recognize this as an AB=CD pattern.
Detailed Structure of the Measured Move
The three waves of the Measured Move pattern have specific parameters which help categorize the formation. We will spend some time in the next section to discuss each of the three waves of the pattern in more detail.
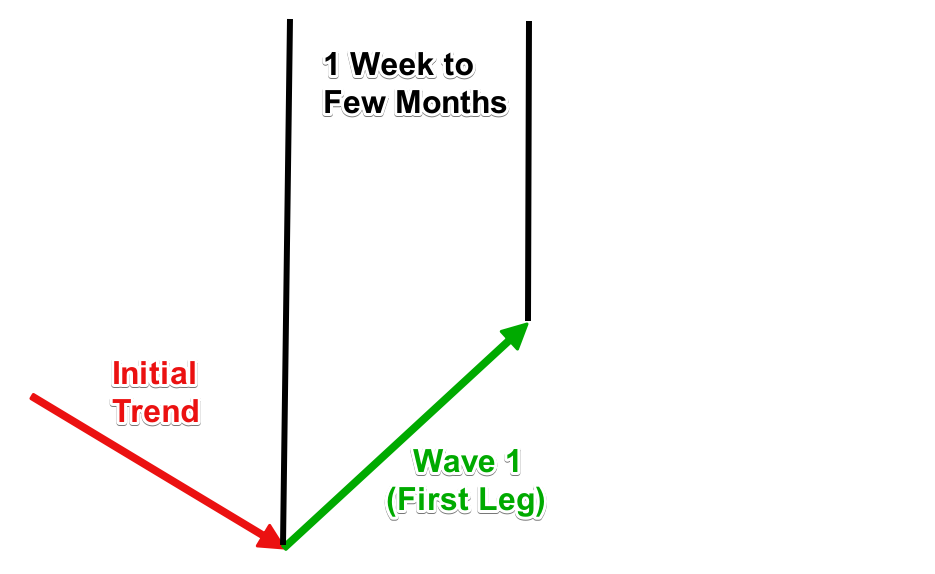
Wave 1 (Impulse Leg)
We will begin by dissecting the bullish version of the pattern. The first wave of the Measured Move is an impulsive leg which begins to correct the prior trend. The occurrence of the impulse leg can often occur as part of a Double Bottom or Inverted Head and Shoulders Pattern. Also, the beginning of the First Leg could also come after a period of consolidation.
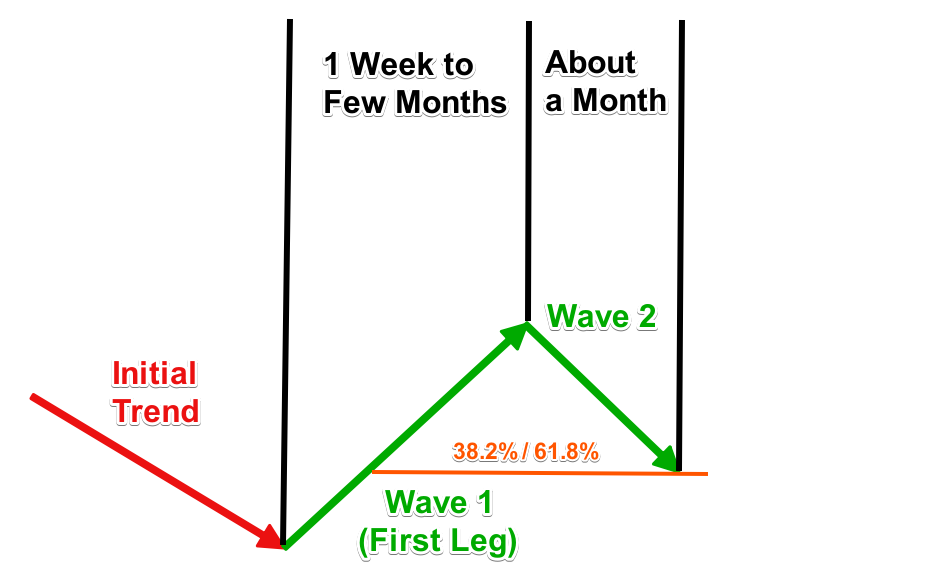
Wave 2 (Corrective Leg)
The 2nd wave can either sharply retrace the First Leg, or it can be a sideways movement. In either case, it plays the role of a correction or a consolidation to the 1st leg of the move.
We use the Fibonacci retracement tool to measure the expected size of the 2nd wave. Statistics shows that the 2nd wave is very likely to reach the area around the 38.2% – 50% retracement if the 1st leg is relatively long or 61.8% if the initial leg is of a normal size.
In some cases, after the 2nd wave is complete, the pattern could begin to resemble a Bullish Flag type of chart pattern.
Wave 3 (Impulse Leg)
The 3rd wave within the Measured Move pattern is an Impulse Leg. This is the leg we have been preparing to trade.
This second Impulse leg (3rd wave) appears after the end of the 2nd wave retracement is complete. As such, it is a continuation of the First Leg. This is the reason we consider the measured move pattern to be a continuation figure even though it begins as a reversal formation.
Some aggressive traders try to enter before the end of the second leg retracement so that they can get an early jump on the third wave, which could provide for an excellent risk to reward potential.
However, keep in mind that the actual confirmation of the Measured Move comes only after the end of the 2nd wave retracement and the beginning of the Second Impulse Leg (the 3rd wave).
We typically want to channel the price action of the 2nd wave retracement and wait for an upside breakout from the channel for confirmation to enter a long trade. A simple trend line or the linear regression channel can both be excellent tools for this application.
As far as the price target for the 2nd impulse leg up, it will likely be equal to the distance traveled by the 1st leg. So essentially, we are looking for the 2nd leg up to travel the same distance in pips as the distance traveled by the 1st leg. Many times this target is exceeded, however, this is considered the pattern projection.
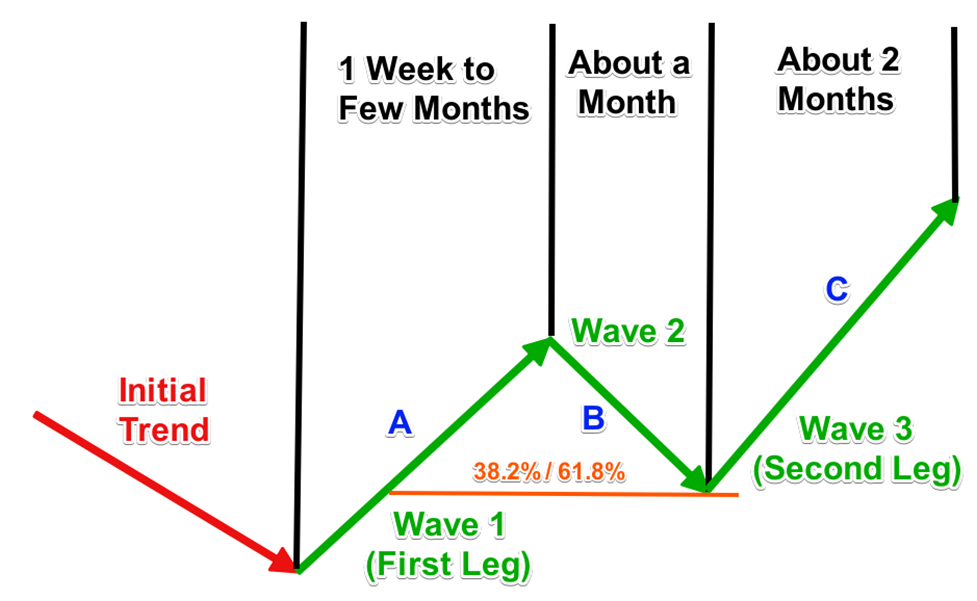
In the sketch above we have illustrated each of the three moves and labeled them as A, B, and C respectively. It’s important to take note of the following:
B = 38.2% , 50% or 61.8% of A
C = A
If you follow the guidelines above, you will be able to properly identify and project the potential of the Measured Move pattern. Also, it is important to note that the price retracements and projections are much more reliable than the time projections. The time projections are shown for illustration purposes but the primary focus should be on the price retracements and projections.
Measured Move Pattern Types
There are two types of Measured Moves depending on their potential. The first one is the bullish Measured Move pattern that we discussed above. The second one is the bearish Measured Move pattern which we will discuss next.
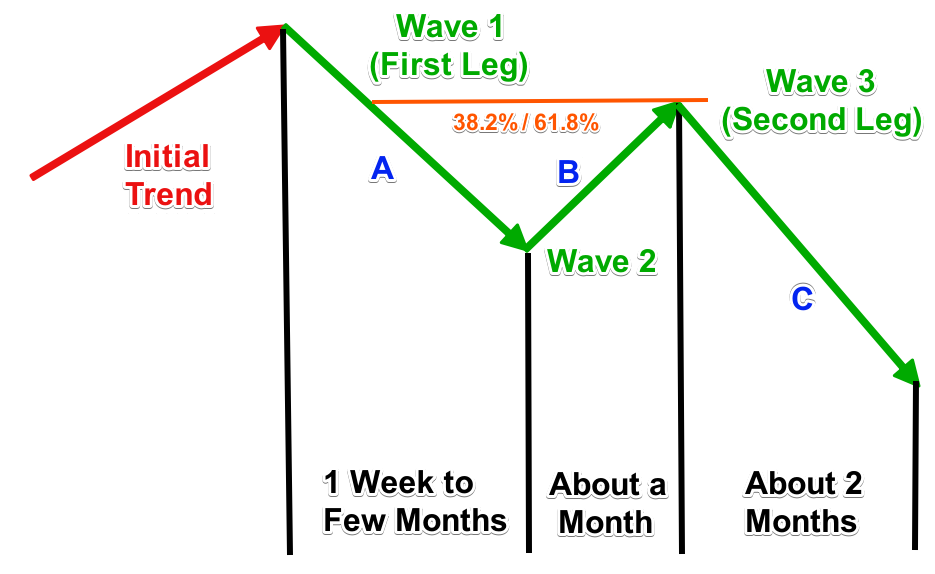
The bearish Measured Move chart pattern has the same rules but are reversed. Wave 1 and 3 are the impulse legs of the bearish Measured Move and are directed downwards. And, the 2nd wave of the bearish Measured Move pattern is a sharp upside correction or sideways consolidation.
This is how the bearish Measured Move appears:
How to Trade the Measured Move Pattern
Now that you are familiar with the structure of the pattern let’s discuss some trading rules that you should follow when attempting to trade this pattern.
How to Enter a Measured Move Trade
To enter a bullish Measured Moves trade, you should buy the market when the price action breaks the upper level of the bearish trend line or linear regression channel of the 2nd wave.
And if you are trading a bearish Measured Move, you should sell the market when the price action breaks the lower level of the bullish trend line or linear regression channel of the 2nd wave.
Measured Move Stop Loss Order
If the pattern is a bullish Measured Move, you should place a stop loss order below the lowest point of the 2nd wave on the chart. On the other hand, if the pattern is bearish, then the stop loss order should go above the highest point of the 2nd wave.
Measured Move Take Profit Target
The Measured Move take profit target is an important level which is calculated using the pattern structure itself.
As you may remember, the Second Impulse Leg (3st wave) is expected to be of equal size as the First Leg (1st wave). Based on this relationship, you should manually measure the vertical size of Wave 1 and apply it starting from the beginning the Wave 3. If the pattern is bullish, you would apply the potential target upwards. If the pattern is bearish, then you apply the target downwards. The image below should make this clear for you.
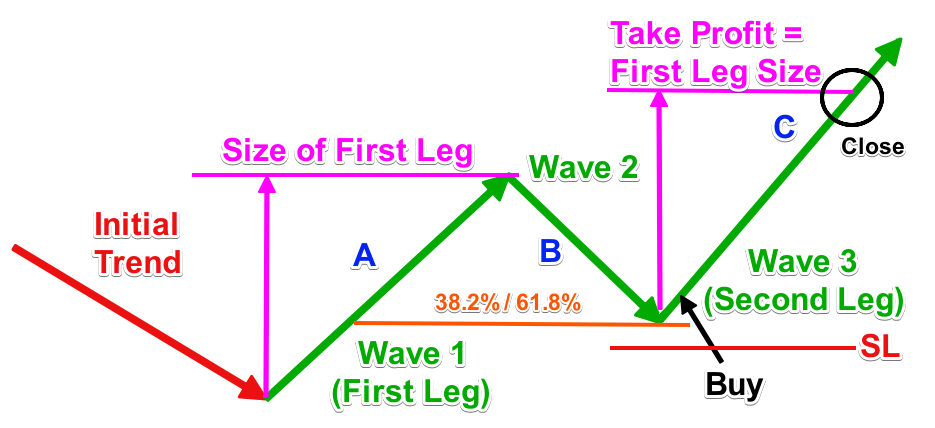
The magenta arrows on the chart measure the size of the First Leg and projects that distance starting from the end of 2nd wave (B). The Measured Move price target is located at the top of the second magenta arrow.
In other words, you would want to buy the currency pair when the price action starts the C move up, and place a stop loss order below the B bottom, and set a fixed price target for the trade at the distance where the C move equals the A move.
Bullish Measured Move Trading Example
Now let’s look at an example of how this would look on an FX price chart:
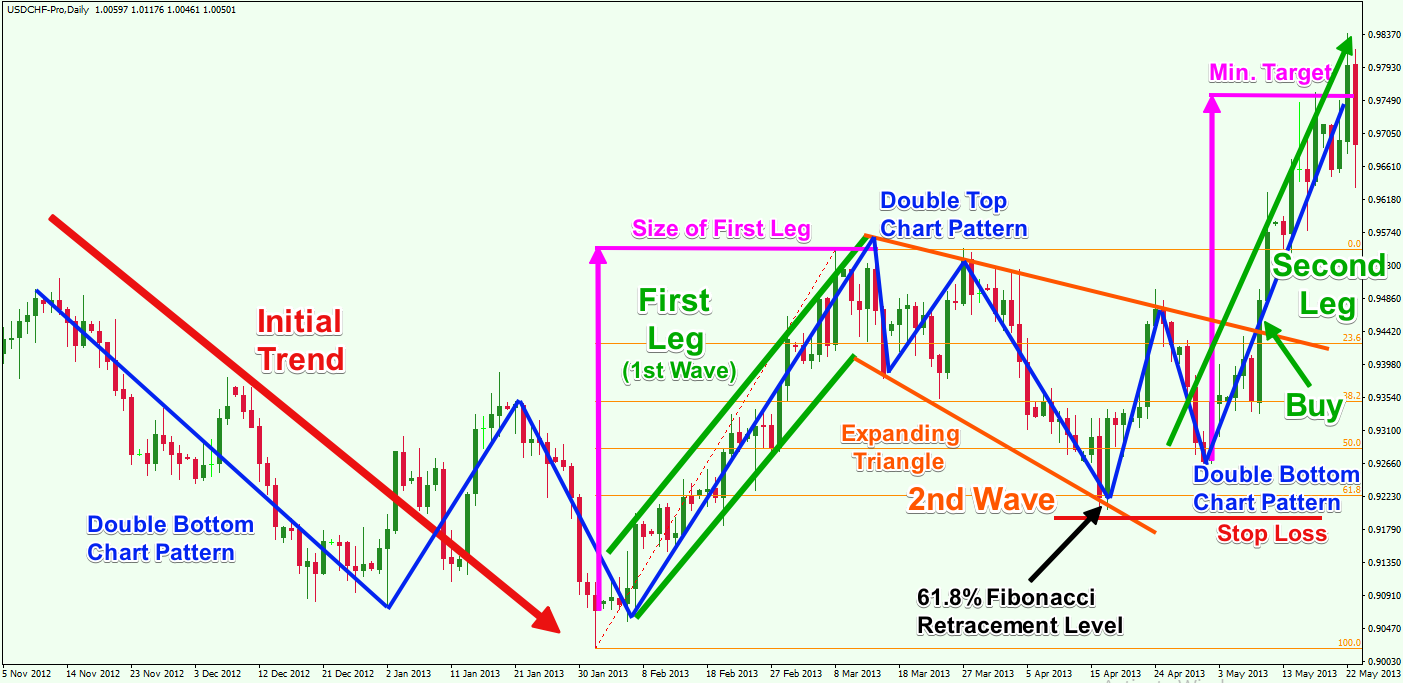
The image above is the daily chart of the USD/CHF Forex pair for Nov 2012 – May 2013. The image shows a bullish Measured Move trading scenario.
As you see, the chart initially starts with a bearish move, which we have marked with the red arrow on the chart. The price action gradually creates a Double Bottom chart pattern (blue lines) that reverses the trend establishing a fresh bullish impulse on the chart – the First Leg of a potential Measured Move chart pattern.
The upswing lasts for one and a half months until the price action reverses again creating the 2nd wave on the chart. Notice that the 2nd wave appears after a Double Top reversal pattern.
Meanwhile, the price action gradually creates an Expanding Triangle with bearish inclination (orange), which is known to have a strong bullish potential. After the Double Top pattern is completed, the price action creates another top on the upper level of the triangle and then breaks it in the bullish direction, confirming the potential of the Measured Move chart pattern.
Notice that the lowest point of the 2nd wave corrects to the 61.8% Fibonacci Retracement level of the First Leg.
To summarize, we have three confirmed bullish chart patterns within the Second Leg as well as a 2nd wave retracement of 61.8% of the First Leg. This provides sufficient evidence for us to enter a long trade on the USD/CHF pair. In this case, we would buy at the breakout through the upper triangle level as shown on the image. We would place our stop loss order below the lowest point of the 2nd wave shown with the red horizontal line.
The magenta arrows measure the size of the First Impulse Leg and it applied to the start of on the Second Impulse Leg ( end of Wave 2). We hold the trade until the price action completes a distance equal to the size of the First Leg, which is the Measured Move price target.
Notice the harmonic nature and structure of the Measured Move pattern and how it responds and reacts to the previous waves within that structure. Also, take note that the Measured Move pattern was accompanied by other chart formations and price action clues as well, which added the weight of evidence on our side and helped our decision-making process on the trade.
Essentially, the market provided us with the necessary information we needed. Our job as traders to is receive and analyze that information in an objective manner and act accordingly.
Bearish Measured Moves Trading Example
Now let’s take a look at a price chart of the bearish version of the Measured Move pattern.
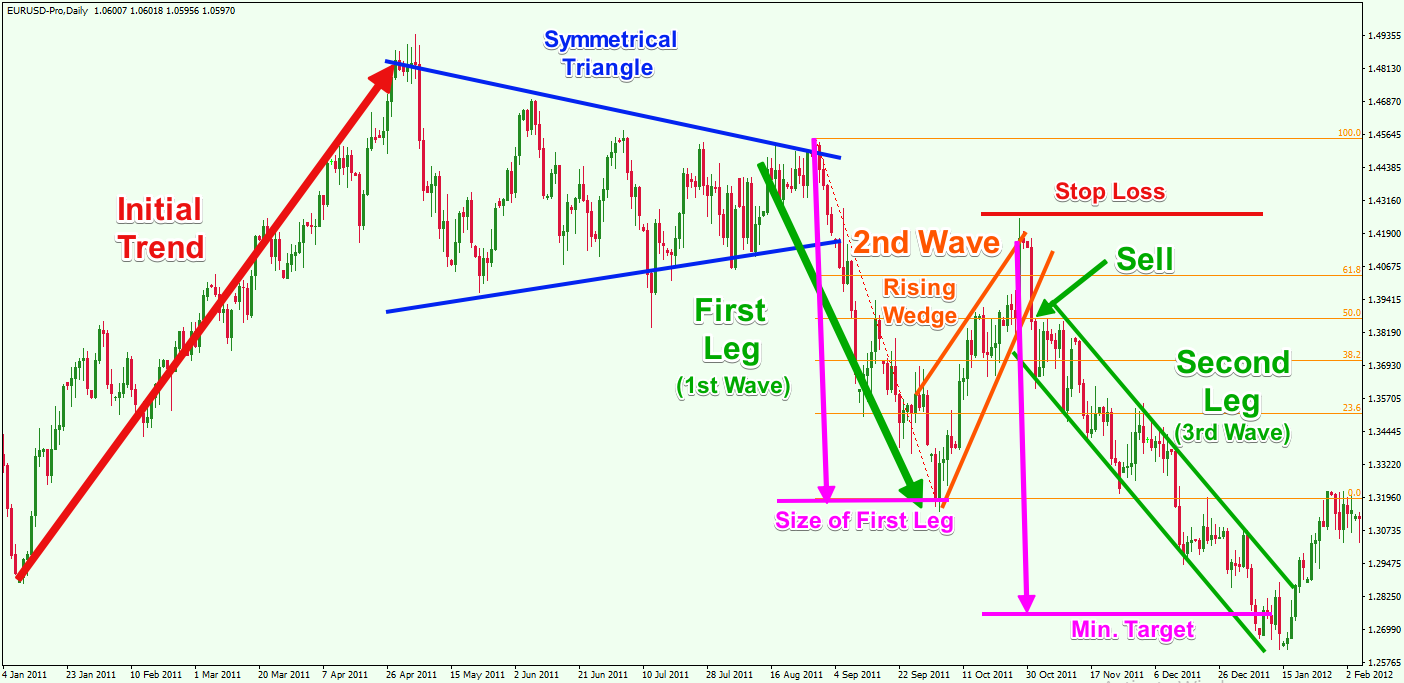
This time we are looking at the daily EUR/USD chart for Jan 2011 – Feb 2012. The image illustrates a bearish Measured Move trade setup.
This time the initial trend is bullish, and it gradually transitions to a consolidation phase. This consolidation resembles a Symmetrical Triangle chart pattern which eventually that gets broken through the lower level.
This is when the price action starts the creation of the First Leg of the potential bearish measured move pattern. The decline lasts for about one month.
Then price action reverses sharply and begins to form the 2nd wave of the pattern. We have a correction in the form of a Rising Wedge chart pattern (orange). The Rising Wedge pattern is known to have a strong bearish potential, which makes it a great trigger for a short trade within this Measured Move pattern. The 2nd wave continues for almost a month.
You would want to sell the EUR/USD when the price action breaks the lower level of the Rising Wedge in the bearish direction. When this happens, you should place a stop loss order above the highest point of the 2nd wave to protect against an adverse price move.
The price of the EUR/USD starts another bearish impulse afterward – (3rd wave). You would want to hold the Measured Move trade until the price action moves in the bearish direction equal to the pip range of the First Leg (the 1st wave).
As you can see on the chart, we have measured the size of the First Impulse Leg, and have applied it starting from the beginning of the Second Impulse Leg (magenta arrows). Your target is located at the end of the second magenta arrow. You would close your trade when the price action reaches this level.
We have some classical chart patterns within this example too. You should keep an eye out for them, as they can be quite helpful when trading the Measured Move pattern. Notice that in this example, the price action exceeded the 61.8% Fibonacci retracement during the 2nd wave retracement.
Though it traveled a bit further than we would have liked, remember that trading is an art and not a science, and that we have to evaluate the totality of the information and make an informed decision based on that. As such, with all the other factors combined and pointing to a bearish move, we were comfortable taking the trade.
Conclusion
- The Measured Move pattern is a high probability 3-wave chart pattern.
- The pattern acts as a reversal of a previous trend, but its potential has continuation character.
- The detailed structure of the pattern consists of:
- Wave 1: It is the First Impulse Leg of the Measured Move pattern. It appears as a reversal of the previous trend. A consolidation could also be present as a transition between the prior trend and the First Leg.
- Wave 2: It reverses the First Leg. In many cases the 2nd wave (in combination with the First Leg) resembles the Flag pattern.
- Wave 3: It is the Second Impulse Leg. This is the wave that we are looking to trade. This Wave is expected to reach a distance equal to the distance traveled by the First Leg.
- There are two types of Measured Move chart patterns based on its directional potential:
- Bullish Measured Move: It comes after a bearish trend, reversing the price action and creating further bullish potential.
- Bearish Measured Move: It comes after a bullish trend, reversing the price action and creating further bearish potential.
- How to trade the Measured Moves chart pattern (bullish):
- Buy when the price action breaks the down sloping trend line or linear regression channel of the 2nd
- Place a stop loss order below the lowest point of the 2nd
- Stay in the trade until the price action completes a distance equal to the size of the First Leg (1st wave).