Harmonic trading is a method of technical analysis widely used across forex, futures, and stocks. Harmonic trading uses certain price patterns which are subject to alignment of specific Fibonacci extension and retracement levels.
Based on the combination of the structure of the pattern and the Fibonacci ratios, harmonic trading identifies potential reversal zones in the security being analyzed.
Harmonic patterns are contrarian reversal patterns and can signal a change in the price direction. This could be a temporary correction or even a change of trend. No technical indicators are used in harmonic pattern trading, except for the Fibonacci extension and retracement tool.
Scott Carney became popular with his books on harmonic patterns trading, the most famous being the “The Harmonic Trader.” This book was published in 1998 and introduced readers on how to trade confluence of Fibonacci ratios alongside specific price patterns. The book is a must read for any serious harmonic trader, as it details his extensive work in this area.
Carney also runs his website, Harmonictrader.com and has developed a harmonic pattern scanner, a software that can identify the various chart patterns based on the concepts of harmonic trading.
The popularity of harmonic trading has given rise to a number of other related tools, scanners and indicators to assist the trader in identifying harmonic pattern setups.
Some of the more common harmonic patterns include:
- The Gartley pattern
- The Bat pattern
- The Crab pattern
- The Butterfly pattern
- The Shark pattern
Besides the above mentioned patterns, there are also other minor variations, such as the Deep Crab pattern, which we will cover in detail in this article.
Although Scott Carney is widely attributed to developing the various harmonic patterns, it was originally H.M. Gartley who first introduced the Gartley pattern in his book “Profits in the Stock Market” in 1935. The Gartley Pattern is often referred to as Gartley 222 because it was first mentioned on page 222 of H.M Garley’s book. However, he did not go into much of the specifics of the pattern in his book, and left many questions unanswered.
More importantly, Fibonacci ratios were missing in the original works of H.M. Gartley. With Carney’s introduction of specific Fib ratios applied to harmonic patterns, this trading methodology became a mainstream subset of pattern based technical analysis.
Harmonic trading can be compared to other concepts of technical analysis such as Elliott Wave trading. No conventional technical indicators (such as moving averages or stochastics oscillators) are used. Rather the entire focus of analyzing the markets is based on a pattern’s structure which is validated by measuring the length of the price movements, specific to the ratios that are outlined.
To be able to trade harmonic patterns effectively, and more importantly the Crab and the Deep Crab pattern, which is the focus of this article, one needs to have a thorough understanding of the composition of these patterns and the specific Fibonacci ratios that confirm these patterns.
Sometimes even a small difference in the level of retracement or extension can invalidate the pattern or even transform it from one pattern into another.
What is the Harmonic Crab pattern?
The Harmonic Crab pattern or The Crab Pattern™ was discovered in 2001. As with all harmonic patterns, the Crab pattern is a reversal pattern. Therefore, we have the bearish Crab pattern that signals a bearish reversal in price and a bullish Crab pattern that signals a bullish reversal in price.
And as with all harmonic patterns, there is a naming convention for each leg in the formation.
Starting with the swing high or low, each leg is marked by a letter. There is a total of five swing points named as X, A, B, C and D. In some harmonic patterns, you will only find four, namely the X, A, B and C.
The Crab pattern is distinct due to its sharp movement in the CD leg. This is usually a 1.618% Fibonacci retracement of the XA leg, the initial part of the Crab pattern.
There are clearly outlined rules that one must follow in order to confirm a Crab pattern. Below are the rules that govern the validity of a Harmonic Crab pattern.
- After the XA leg in price, the point B is a retracement of between 38.2% up to 61.8%. This retracement of XA should ideally be less than 61.8%
- The AB leg, is a counter trend move to the previous leg
- Following point B, the next leg, BC can run up to 38.2% – 88.6% Fib ratios of the AB leg. (C should never exceed point A)
- Following the BC leg, price then reverses again (moving counter direction to XA). The CD leg is the longest and usually reverses between 161.8% of the XA leg and an extreme 224.0% – 361.8% extension of the BC leg
Once a Crab pattern validates the above factors, a position can be taken after the CD leg is formed. Although you will not find the CD leg to always reverse near 161.8%, if price action begins to stall and such a reversal begins to occur, it can be a very high probability trade setup.
It is always best to wait until point D is formed and then take an appropriate long or short position.
Stops are placed at the low or the high of D, and targets are typically points A or B in the pattern.
Figure 1 illustrates the Harmonic Crab pattern, showing both the bullish and bearish Crab reversal patterns.
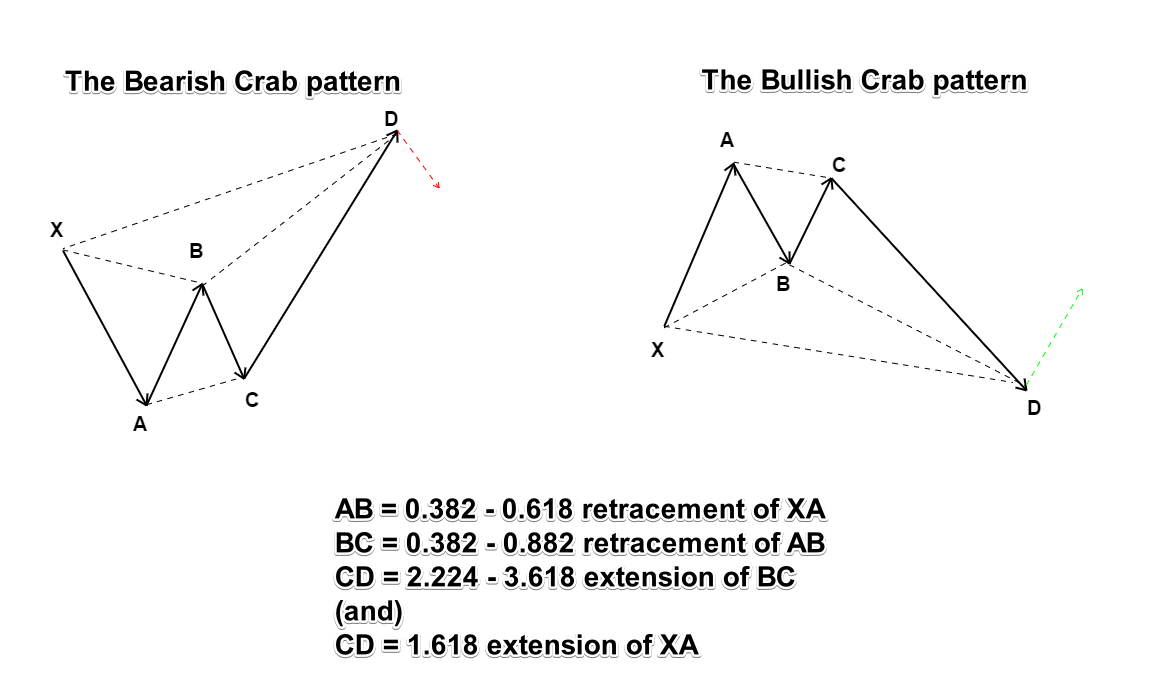
Figure 1: Bearish and Bullish Harmonic Crab pattern rules
The arrowed lines show the price direction, while the dotted lines show the Fibonacci levels. As you can see, the most distinctive part of the Crab formation is the price extension of the CD leg.
Drawing the Harmonic Crab pattern
It can be difficult to memorize the Fibonacci retracement and extension values in a Harmonic Crab pattern. Furthermore, it can become tedious when using the Fibonacci tool to measure each leg while drawing the Harmonic Crab pattern.
Besides the main rules of the Harmonic Crab pattern, traders can look for the following tell-tale signs in the market, by analyzing the high and lows and simply observing the price action.
- BC leg usually forms within the XA leg
- C is a higher low compared to A in a bearish Crab pattern or C is the lower high compared to A in a bullish Crab pattern
- B forms a lower high compared to X in a bearish Crab pattern, or B forms a higher low compared to X in a bullish Crab pattern
- D is the extreme, marking a higher high or a lower low, extending beyond X
Figure 2 shows a bearish Crab pattern that was formed on a 30-minute GBPJPY chart and depicts how a real-time Crab pattern is drawn (and traded).
Note that in this example, we made use of multiple Fibonacci tools to illustrate the retracement and extension levels in the Harmonic Crab formation.
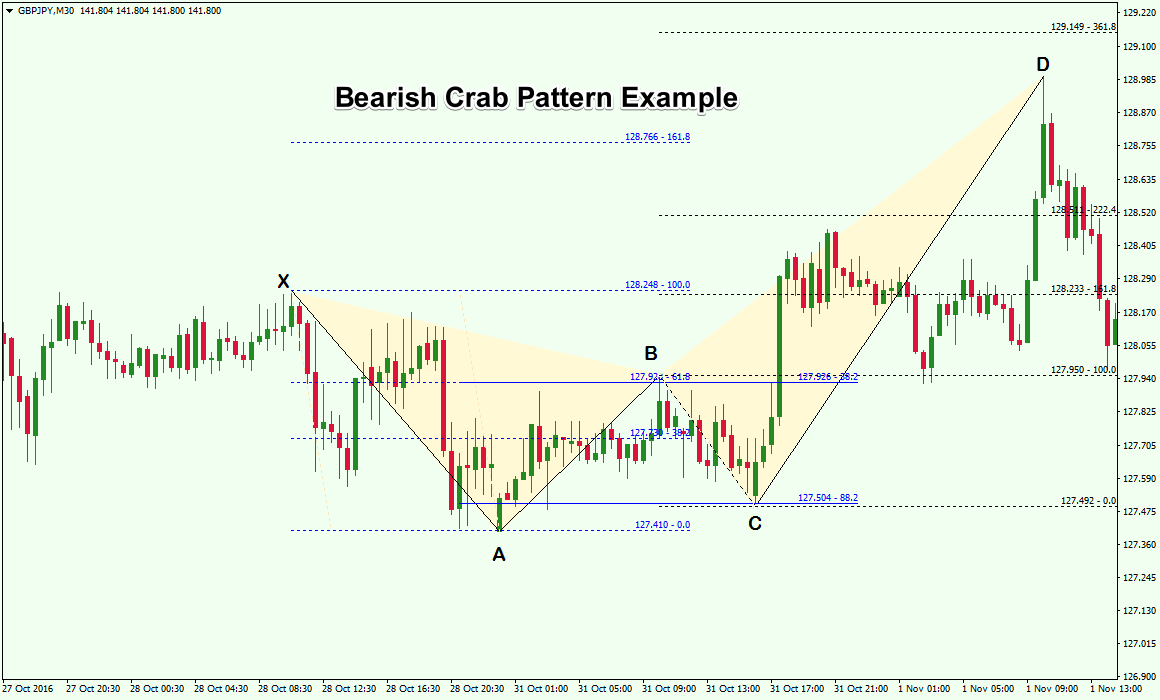
Figure 2: Bearish Crab pattern
In figure 2, following the XA leg, we notice the lower high formed at B. Using the fib ratios for the Crab pattern, we can validate the following.
- The XA retracement levels are checked to validate the retracement (here, pivot B forms just near 61.8%, barely making it to qualify for the Crab pattern
- At point C, we notice the retracement falling within AB’s 88.2% – 38.2% zone
- Eventually, price surges higher to reach to 161.8% Fibonacci extension of XA and fits within the 222.4% – 361.8% extension of the CD leg
- Following the high, a short position could be taken, with stops at the high of CD, which marks the price reversal zone (PRZ).
Crab pattern vs. Butterfly pattern
A commonly recurring question is the difference or similarities between the Crab pattern vs. the Butterfly pattern.
The two main aspects that differentiates the Crab pattern from the Butterfly pattern is that in a Butterfly harmonic pattern, the swing point D ends at the 127.2% Fibonacci extension of the XA leg. In addition, the Butterfly pattern should retrace to 78.6% of the initial XA leg.
In contrast, when you look to the Crab pattern, the swing point D ends at the 161.8% extension of the XA leg and terminates the AB leg between 38.2% and 61.8%
These two primary differences in the Fibonacci ratios between the Crab pattern and the Butterfly pattern make it unique from one another.
The Deep Crab pattern
The Deep Crab pattern on the price chart differs from the Crab pattern on one main aspect, which is the swing point B.
While in a regular Crab pattern, the B retracement fits within 38.2% – 61.8%% retracement of XA, with the Deep Crab pattern the swing point B sits at the 88.6% retracement level of XA.
Another qualification criterion with a deep crap formation is the AB =CD. This rule suggests that the legs AB and CD must be equal in length.
However, in real world trading, this isn’t always the case, and you need some flexibility in judging the Deep Crab pattern. Looking for a perfect combination of all the rules will make it very difficult to trade the Deep Crab pattern.
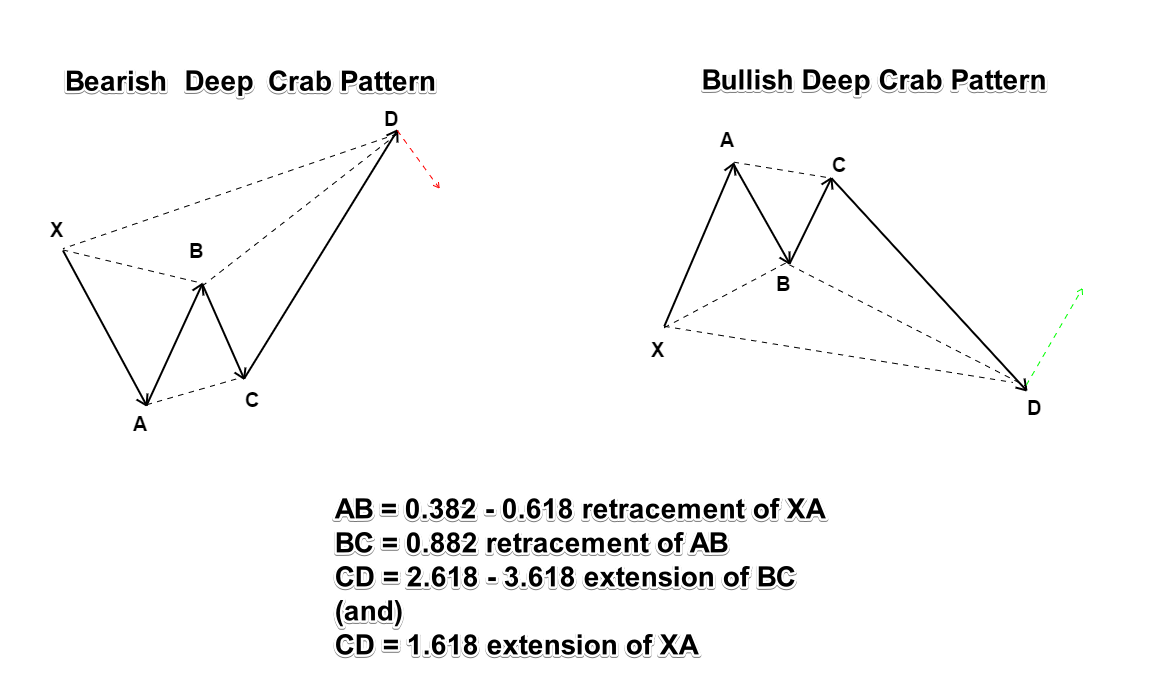
Figure 3: The Deep Crab Pattern formation
Figure 3 shows the Deep Crab formation with the bullish and bearish variations.
Below are the rules to validate the Deep Crab formation.
- After the XA leg in price, the swing point B is a retracement of 88.6% of the XA leg
- Following swing point B, the next leg, BC can run up to 38.2% – 88.6% Fib ratios of the AB leg
- The CD leg reverses at 161.8% of the XA leg and an extreme (261.8% – 361.8%) extension of the BC leg
In Figure 4, we have an example of a bearish Deep Crab pattern on a forex chart. The instrument being used is the EURJPY. Keep in mind, this is not a perfect textbook scenario. But it is a good real world example that you will encounter on your charts. Each trader will need to evaluate their own level of comfort when it comes to how rigid you will be in adhering to the exact rules for selecting the formations to trade.
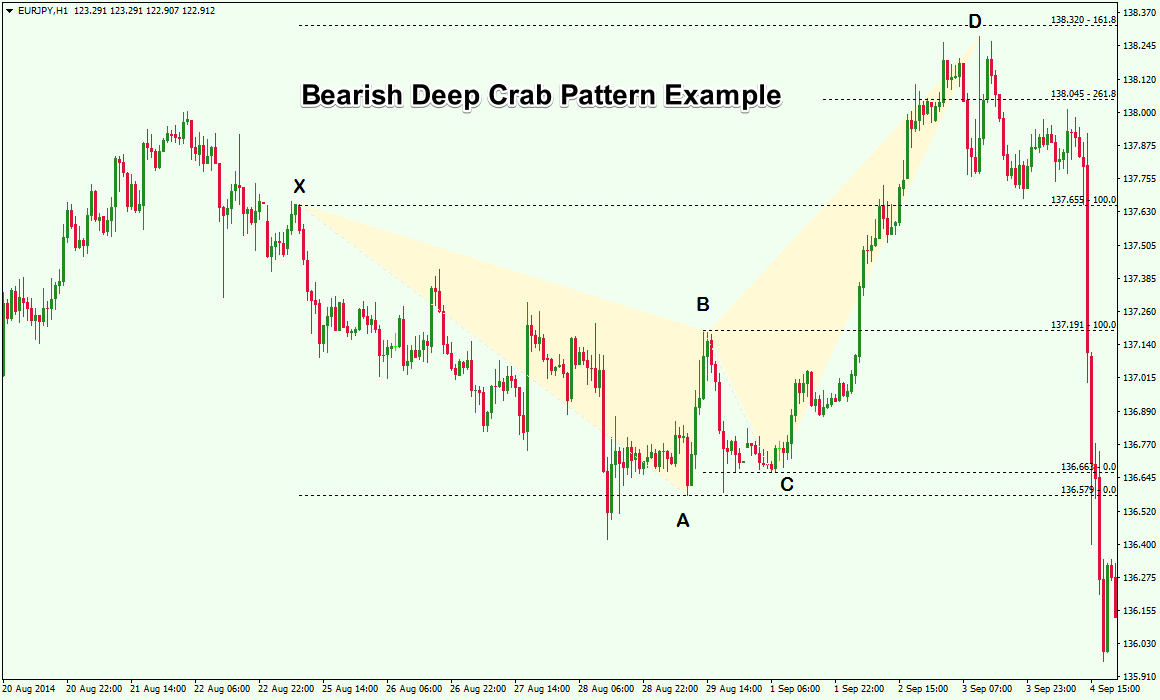
Figure 4: Bearish Deep Crab Pattern Example
In Figure 4, you can see that the Deep Crab pattern is validated by the extension of the CD leg, which falls between 261.8% and 361.8% Fibonacci extension of the BC leg. However, we notice here that the Deep Crab pattern did not quite rally exactly to 161.8% of the XA leg. This is where some subjectivity is required when analyzing whether a harmonic pattern is valid or not.
If one goes strictly by the rules, this deep crab pattern may have been disqualified. However, if one is flexible, you can see how price reverses sharply thereafter from swing point D, despite not quite reversing exactly at the 161.8% Fibonacci extension level.
The stop loss and target levels for the above Deep Crab pattern example is similar to the Crab pattern. Long or short positions are taken after the CD leg is formed. Stops are placed above or below the point D, depending on whether you are long or short.
Targets are placed at point A and/or point B.
The Deep Crab pattern can be a rare occurrence and therefore looking for the setup as outlined by the exact rules could mean that traders may have to filter aggressively to find the right pattern to trade. This is where each harmonic trader will use their own discretion in trade selection.
Tools for Locating Harmonic patterns in Forex
Harmonic patterns occur across different time frames and instruments. But it can get a bit overwhelming when it comes to manually scouting for these formations in the market.
Thankfully there are trading tools such as the ZUP indicator in MT4 that can be of great assistance to forex traders interested in trading harmonic patterns.
There is also a collection of paid and other free harmonic pattern indicators and harmonic pattern scanner tools that can help traders in scanning the forex markets for relevant harmonic structures. Many of these are usually compatible with the Metatrader platform.
The ZUP indicator is one of the most popular harmonic indicators and it is derived using MT4’s zig-zag indicator and also includes the relevant Fib ratios within it. The ZUP indicator for MT4 can be downloaded from forums such as Forexfactory.
The indicator, used to identify harmonic patterns does require some getting used to. This is because there are quite a few settings involved and you can even apply the zup indicator to validate some other complex Fibonacci based methods as well.
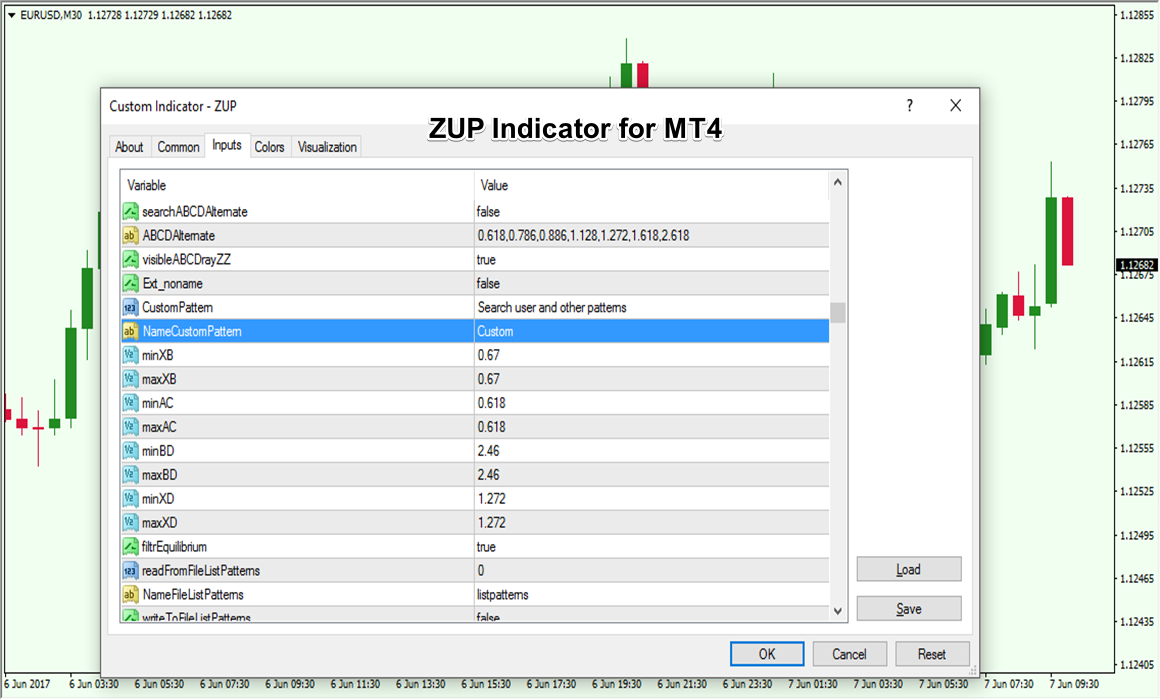
Figure 5: ZUP indicator for MT4
Figure 5 shows the ZUP indicator for MT4 and the various settings. As you can see, there are several settings that allows one to completely customize this trading indicator. For one, you can use the ZUP indicator to define the Fibonacci ratios so the indicator will search specifically for these patterns.
You should remember though that no indicator can fully show you the scope of the market and therefore one should not overly rely on the ZUP indicator or any indicator for that matter. As with most things in forex trading, it is important to learn the concepts manually and always have a keen eye on the price action prevailing in the market.
A good manual exercise is to use the default zig-zag indicator in the metatrader platform. This indicator can plot pivot highs and lows. Traders can then measure each of the swing points using the Fibonacci tool and judge whether a Crab or a Deep Crab or any other harmonic patterns are forming.
You can use the simple method outlined earlier on how to observe the price patterns and then investigate in more detail when you find a harmonic pattern that is of interest.
Still, for those who prefer some automation for harmonic pattern recognition, using the ZUP indicator or other related harmonic trading tool should suffice and provide some time savings.
In addition, there are many communities, forums and websites that are dedicated to teaching how to trade harmonic patterns. So, there is no lack of available resources if you have more questions or would like to gain a deeper understanding of harmonic patterns.
What makes harmonic patterns trading so unique is that there is a precise method to the process. The objectivity required to validate the patterns makes it easy for traders to follow the rules and trade accordingly. This objectivity has also helped in the development of many tools that can automatically identify harmonic patterns in the market.
Another benefit of trading harmonic patterns is the relatively tight stop loss and higher reward to risk ratio you can get when these setups are traded correctly. As we have seen in the above cited examples of the Crab and the Deep Crab patterns, the stop loss is usually very small relative to the potential rewards that these patterns can generate.
There are other classical chart patterns in technical analysis including the head and shoulders pattern, or the double top and double bottom patterns to name a few. These classical patterns, however, involve a lot more subjectivity compared with harmonic patterns. This is likely what makes harmonic patterns so popular for analyzing the markets versus other types of pattern analysis.
There is no denying the fact that using harmonic trading requires a bit of practice. It is not as simple as the bullish and bearish signals given by a moving average or other price based technical indicator. But for those that have the desire and patience to learn and apply the harmonic trading technique, they can rest assured in knowing that with the proper foundation and practice, there are few other trading methods that would provide a better edge in the market.