Chart patterns are a crucial component of technical analysis. Each classical chart pattern provides the trader with a unique outlook on potential price movement.
In general, chart patterns can be classified into two classes based on their potential price move – continuation and reversal. Today we will discuss one high probability continuation chart formation known as the Flag pattern. The following material will teach you how to recognize and trade the bearish and the bullish Flag pattern like a Pro.
What is the Forex Flag Pattern?
The Forex Flag pattern is one of the best-known continuation formations in trading. It is an on-chart figure, which typically appears as a minor consolidation between impulsive legs of a trend. When this pattern forms on the chart, there is a high likelihood that the price action will breakout in the direction of the prevailing trend. We will discuss this in more detail but for now, let’s get familiar with the technical structure of the Flag pattern.
Structure of the Forex Flag Pattern
The Flag pattern consists of two parts – a flag pole and a flag. Let’s take a closer look at each of these two components:
The Flag Pole
The first component of the Flag chart pattern is the Flag Pole. It represents a trend impulse on the chart. Every trending move could transition into a Flag, which brings us to the statement that every trend impulse could appear to be a flag pole.
As a Flag pattern is emerging you will note the large impulse move, which is referred to as the Flag Pole. A brief consolidation will follow and this consolidation takes on the appearance of a Flag.
The Flag
After creating the pole, a valid Flag pattern will then begin to trade within a tight range, taking on the shape of a Flag. The Flag consists of price action with evenly distributed tops and bottoms. At the same time, this price action has a corrective character on the graph. In this manner, it is angled contrary to the trend impulse creating the pole.
Take a look at this image below, which will make the picture clearer for you:
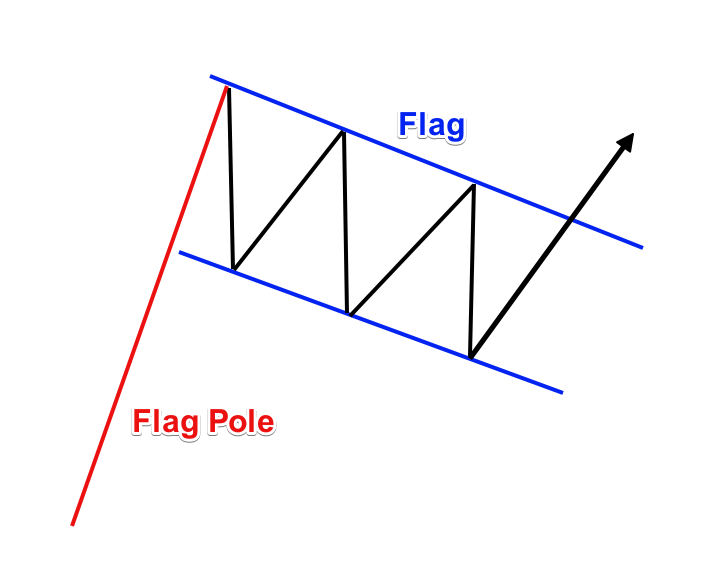
This is a sketch of the Flag chart pattern. The red line is the pole of the flag and the blue channel is the flag. This is how the Flag pattern is created, and as the name implies it really does look like a flag, doesn’t it? This chart pattern is relatively easy to recognize once you know what to look for.
Flag Pattern Potential
As we said, the Flag Pattern has a continuation potential on the chart. And so, a valid flag pattern is likely to push the price action further in the direction of the Flag Pole – the trend impulse. In addition to this, when you spot a Flag formation on your price chart, you will be equipped to measure the approximate price target of the formation. There are two targets related to the Flag chart figure:
Target 1: Size of the Flag
The first target of a confirmed Flag pattern can be derived using the measured move technique. The measured move target is a distance equal to the size of the flag. To measure the size of the flag, you would just take the vertical distance between the upper and the lower channel within the flag.
Then you would apply this distance starting from the breakout point. Your first target is located at the end of this distance.
Target 2: Size of the Pole
The next target of the Flag formation equals the size of the Flag Pole. So, to get this target 2, you need to measure the vertical distance between the high and the low of the Pole. Once you get that distance, you will need to apply it to the pattern. Again, as we did with Target 1, you would apply it starting from the breakout point.
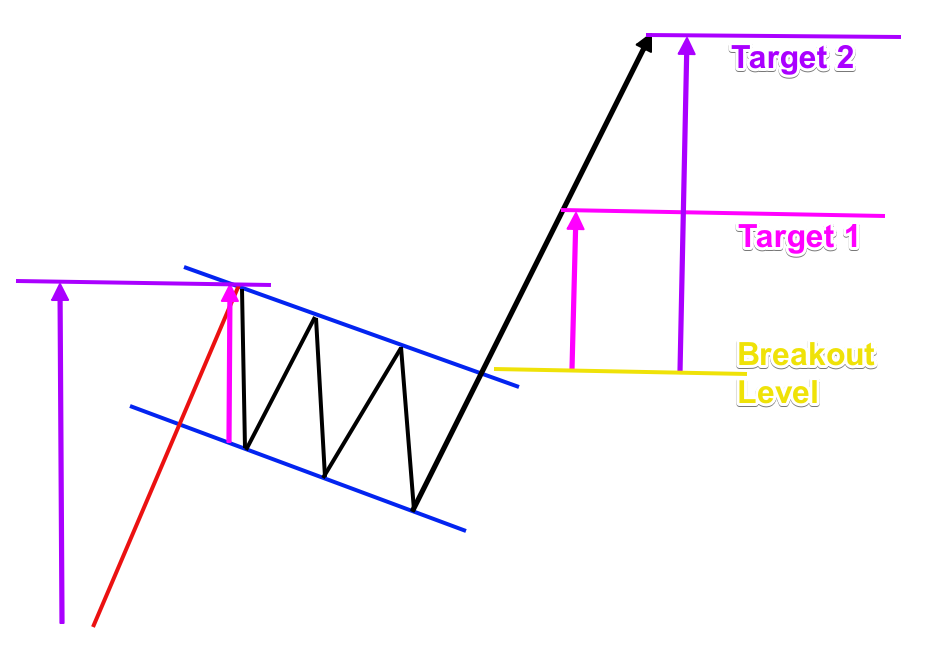
The sketch above shows the two targets of the pattern. The first target is marked with the magenta arrows and the magenta line. It measures the vertical size of the flag contained within the channel marked in blue. The second target is marked with the purple arrows and the purple line on the chart. It measures the vertical size of the Flag Pole.
Notice that both lengths are applied starting from the breakout level of the pattern.
Price Action Trade Management
Most times, after the Flag completes the two targets, you would want to close out the entire position and bank your profits. But in some instances, you may decide to keep a small position open to ride out a larger trend move. So, if you continue to see signs of a strong trend even after Target 2 has been reached, then by all means, keep a portion of the position open. Make sure to manage your trade using price action based clues to determine a final exit point.
For example, the trend line indicator can be very helpful in managing a possible runner. You can decide to stay with the trade as long as the trend line is intact.
Support and Resistance rules are of a great importance too. If you see the price hitting a level, and then bouncing contrary to the trend, then the trend might be getting exhausted. On the other hand, if you see the price breaking a level with increasing momentum, then this might mean that the trend is gaining strength.
Another important consideration would be candlestick signals and the chart patterns. A reversal pattern might provide enough reason to close out the trade and book profits.
Types of Flag Patterns
There are two types of Flag chart patterns based on their structure and potential – a bearish Flag and a bullish Flag. Each of these is the absolute opposite of the other. Let’s dive a little deeper into the details of each now.
Bear Flag Pattern
The bear Flag pattern forms during bearish trends. The figure starts with a bearish trend impulse and turns into a correction, which is directed upwards. During the correction phase, the tops and the bottoms are evenly distributed, creating a parallel channel.
The confirmation of the Bear Flag setup comes when the price action breaks the flag channel boundary downwards. When the breakout occurs, we have the opportunity to short the currency pair.
This is how the bear flag pattern appears:
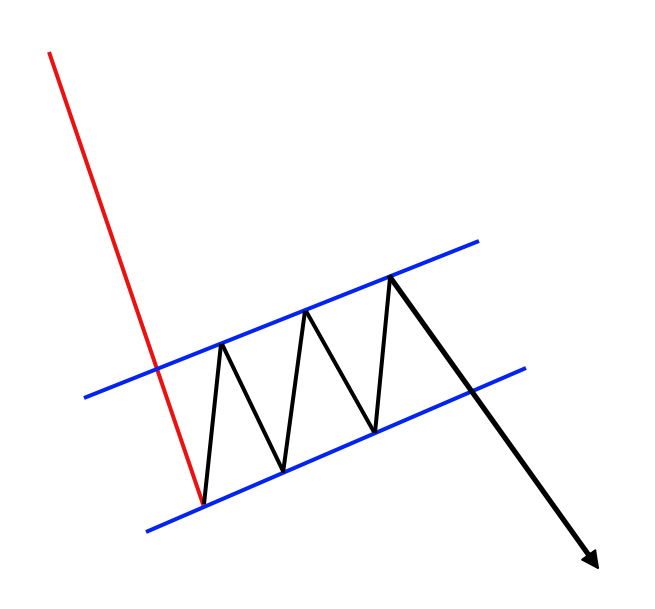
Notice that the Flag Pole is in a bearish direction. The Flag is a bullish correction. Upon breakout of the lower channel line, we expect to see a continuation of the prevailing bearish trend.
Bull Flag Pattern
The Bull Flag pattern is the absolute opposite of the Bear Flag pattern in appearance. First, it forms during bullish trends. The pattern begins with a bullish trending move, which then pauses and turns into a minor bearish correction. The tops and the bottom of this correction are parallel as well.
The confirmation of the Bullish Flag pattern happens with the upside breakout, and we would prepare for a long position. Then we apply the same target rules as discussed earlier.
Now let’s look at a sketch of the Bull Flag Pattern:
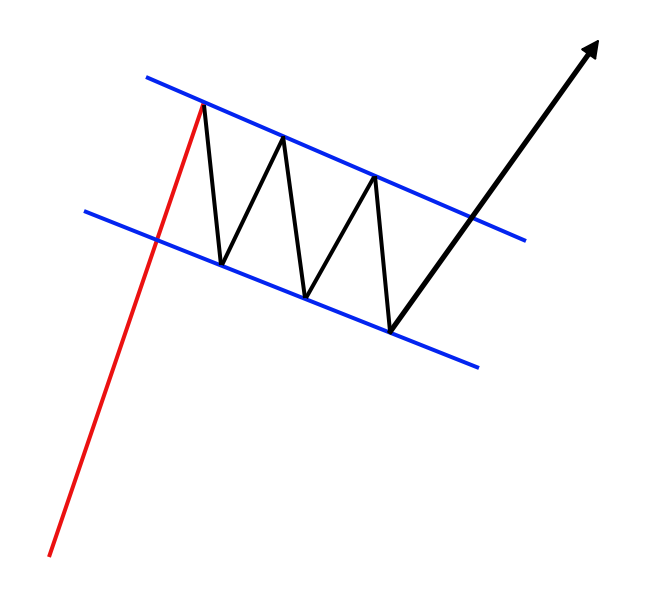
Notice the bullish Flag pattern starts with a bullish Flag Pole, which turns into a bearish correction. Upon breakout of the upper channel line, we expect to see a continuation of the prevailing bullish trend.
Trading the Flag Formation
Now that we have discussed some of the characteristics of the Bull and Bear Flag, I now want to shift the attention to creating a concrete trading strategy around this setup. Next, we will develop some rules and guidelines for effectively trading with the Flag pattern.
Flag Pattern Trade Entry
To enter a Flag pattern trade, should first attain a confirmation signal. The confirmation of the Flag comes with the breakout.
If you have a bullish flag, you will buy the Forex pair when the price action closes a candle above the upper side. If you have a bearish flag, then you would sell the pair when you see a candle closing below the lower level of the pattern.
Flag Pattern Stop Loss
After you open your Flag trade, you should position your stop loss order. This is needed to protect your trade from unexpected price moves.
One basic rule should be considered when determining the proper stop loss placement for this type of trade. If the price breaches the opposite side of the breakout, then you should immediately exit the trade, because the pattern is most likely false. The most logical location to place the stop loss would be beyond the most extreme swing within the Flag structure. So, if you were trading a bullish flag, then your stop should be placed below the lowest bottom in the Flag. Conversely, if you were trading a bearish Flag, then your stop should be placed above the highest top in the Flag.
Flag Pattern Take Profit
The take profit for the Flag pattern should be addressed using the two targets we discussed earlier. It is up to you which target you are going to pursue. However, I would suggest taking profits at each target level to reduce risk and book profits.
Of course, each trader will have their own trade management style that best suits them. Below is one example of how you might choose to manage a Bullish Flag trade.
When you open your Flag trade, you put a stop loss below the extreme point of the Flag. When the price increases and completes the size of the Flag, you can close out 1/3 of your position size and book the profits.
Also, you would adjust your stop loss order by raising it just below the initial target level. Then if the price continues to increase and reaches your second target level, you can close another 1/3 of the position to lock in your profits further. Now on your remaining trade, you adjust your stop again so that it will be located just below the second target. If the price continues to trend upwards, then you could carefully monitor price action and hold the last 1/3 of the trade position for as long as it seems prudent.
Technical Analysis Using Flag Patterns
By now you should be getting more familiar with trading the Flag chart formation. But there is nothing like actual charts to clarify the ideas presented so far. So now we will shift our attention to some practical chart examples using Flag Patterns.
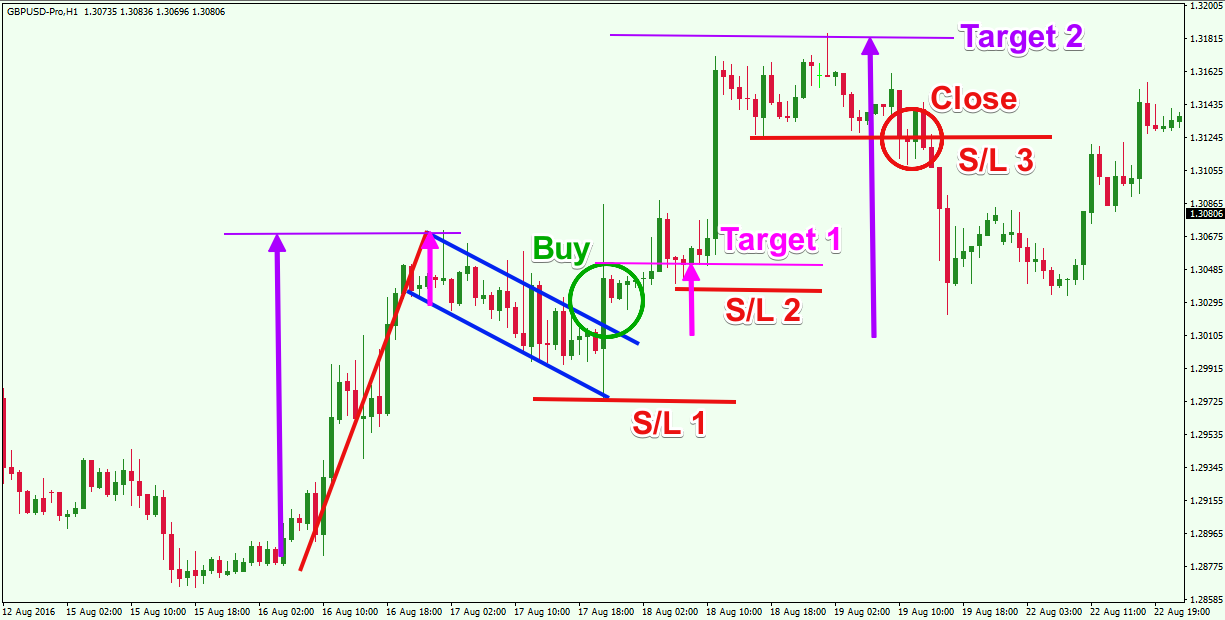
This is the hourly chart of the GBP/USD Forex pair. The image illustrates how you would perform your analysis to arrive at a potential trading opportunity. You will see the red Flag Pole and the blue Flag channel on the chart.
In the green circle, you see the moment when the price action broke through the upper level of the Flag. This confirmed the pattern, which creates a long opportunity on the chart. The green circle is the appropriate time in which to buy the GBP/USD Forex pair.
Once the trade is executed, you should put your initial stop loss right below the lowest point of the flag as shown on the image (S/L 1). Then with each target the Stop Loss order should be moved upwards, locking in profits as price advances. The two-other trailing stop loss orders are shown with S/L 2 and S/L 3.
The magenta and the purple arrows measure the size of the Flag and the size of the Pole. As you can see, these two sizes are applied on the chart starting from the breakout point. Each of these two targets are reached. And as each target is hit, the stop loss order should be adjusted accordingly as shown on the image above.
The end of the trade would come when the GBP/USD price breaks the third Stop Loss order (S/L 3). As you see, the price reverses afterward, which would have created unpleasant conditions for the long trade.
Difference between Flags and Pennants
The Pennant formation is another continuation pattern which strongly resembles the Flag. The main difference between the two patterns is the shape of the correction which comes after the Pole. The Flag pattern creates a channel correction, while the Pennant creates a triangle correction. In both cases, though, the potential of the patterns is the same.
As with Flags, there are two types of Pennants – bullish Pennant and bearish Pennant. They are traded the same way as the Flag and the target rules are absolutely identical. If the Flag is bullish, you go long when the price breaks the upper level of the Flag. If the Pennant is bullish, you go long when the price action breaks the upper level of the triangle correction.
Let me illustrate a Pennant setup on the chart below:
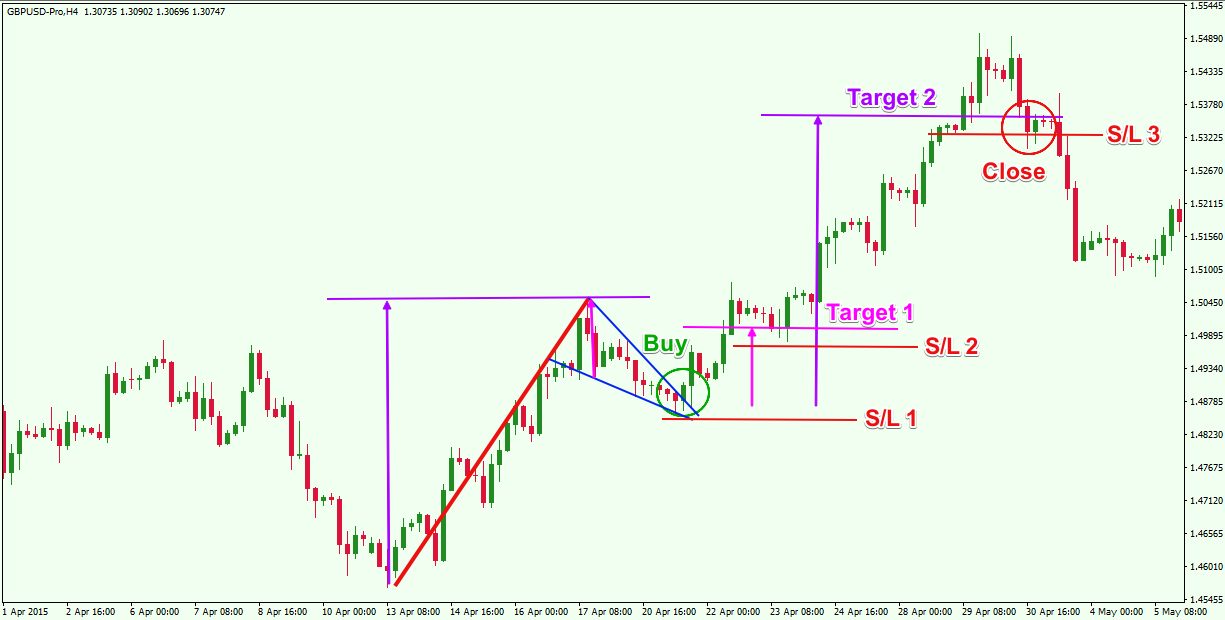
We are now looking at the H4 chart of the GBP/USD, which shows a bullish Pennant chart pattern. The pattern consists of the blue triangle and the thicker red bullish line, which is the Pole of the Pennant.
The buy signal on this chart comes when the price action creates a bullish breakout through the upper level of the pennant. This is shown with the green circle on the chart. In this case you should put a stop loss order below the lowest point of the pennant as shown on the image.
Then you need to apply the targets of the pattern. This is shown with the purple and the magenta arrows on the chart. The first target equals the vertical size of the blue triangle measured from the highest point. The second target equals to the vertical size of the Pole.
Notice that the price completes both targets, which means the stop loss order could be adjusted twice. This is shown with the red horizontal lines on the image (S/L 2; S/L 3;).
The trade could be held until the price action crosses the last stop loss order downwards.
As you can see, The Pennant formation is very similar to the Flag pattern, and the same rules apply for trading both. Remember, the only difference between Flags and Pennants is in the nature of the correction.
Conclusion
- The Flag pattern is one of the most popular continuation patterns.
- It consists of two basic elements:
- Flag Pole – the current trend
- Flag – a trend correction with a channel structure
- There are two main targets related with the Flag pattern:
- Target 1 – equals the vertical size of the Flag and should be applied starting from the moment of the breakout
- Target 2 – equals the vertical size of the Flag Pole and should also be applied starting from the moment of the breakout
- There are two types of Flags based on their potential:
- Bearish Flag
- It starts with a bearish move, followed by a channel correction in bullish
- It has bearish potential.
- Bullish Flag
- It starts with a bullish move, followed by a channel correction in bearish
- It has bullish potential.
- Some rules for trading Flags in Forex:
- Enter a trade when the price action breaks the Flag in the direction of the trend.
- Put a stop loss beyond the opposite extreme of the Flag.
- Take profits at each of the targets. You can adjust your stop loss just beyond the completed target.
- The difference between Flags and Pennants is in the correction, which comes after the Pole.
- The Flag has a channel correction.
- The Pennant has a Triangle correction, which is angled contrary to the trend.
- Bearish Flag