 Forex trading using economic indicators can be tough, as traders are overwhelmed with a variety of information which can lead to overanalyzing the market and even become counter-productive. To avoid information overload, traders should concentrate on the primary economic indicators that influence the market.
What are Economic Indicators?
Economic indicators can help represent the various economic activities of a country or region. They give valuable insight into present business performance, as well as future direction of an economy.
Before we explain the different types of economic indicators, let’s first see how indicators are classified according to the business cycle. The business cycle is a very important concept in modern economics. It represents a fluctuation in the general economic activity, with highs and lows, expansions and contractions which happen periodically. For example, a contraction in the economic activity which leads to a negative growth of the gross domestic product in two successive quarters is considered a recession.
Economic Indicators are usually classified in several ways. The major types of economic indicators are leading, coincident and lagging indicators.
Economic Indicators that predict future changes in economic activity are called leading indicators. Indicators that change simultaneously with the change in economic activity are called coincident indicators. And finally, indicators that confirm that a change in the economic activity has happened are called lagging indicators.
Unfortunately for traders there is no one leading forex economic indicator data set that can successfully predict all future level of economic activity and the change and direction of a currency’s exchange rate.
A holy grail in the forex market is still not available to traders despite some forex advertisements you may see to the contrary.
In this article, we present the major forex economic indicators that affect the forex market, with the ability to predict future price changes of currencies. Traders should make sure use a reliable economic indicators calendar and prepare for potential increased market volatility during those reports.
 Employment Reports
The employment situation is one of the most important among the forex fundamental analysis indicators that every trader should watch closely. Job creation can reveal a lot regarding the general state of an economy. It is closely linked to future consumer spending, and for the US economy, consumer spending makes up the largest share of GDP with around 70%. The labor data report is a leading economic indicator and can tell us a lot about future economic growth.
The US Bureau of Labor Statistics releases the employment report on the first Friday of every month, at 8:30 EST. Most professional traders and Institutional traders plan most of their week around it, as it is usually the highest volatility scheduled market event for the month.
The US employment report includes a number of labor indicators which are released simultaneously: the non-farm payrolls, the average hourly earnings and the unemployment rate. To understand and trade the employment report successfully, traders need to be aware of all these figures related to the overall release. For example, the impact of a rising non-farm payrolls number can easily be canceled if the average hourly earnings didn’t meet expectations. A falling unemployment rate is usually followed by an increased pressure to raise wages, as fewer people in the workforce are available to meet the demand by companies and hiring managers.
Non-Farm Payrolls Report
Among the employment indicators, it’s the NFP number that has the most impact on the markets and the US dollar. The non-farm payrolls (NFP) number include all jobs apart from self-employment, farm work, and jobs in the military and intelligence service. The NFP number reveals how companies and their hiring managers view the current and upcoming economic situation. Companies will be reluctant to add to their payrolls if they expect that an expanding number of workers will not be necessary in the future. Similarly, businesses will not dismiss their workforce if they assume that the future economic environment will increase demand for their products.
Positive NFP numbers are usually beneficial to the US dollar, while disappointing non-farm payrolls typically result in a falling dollar. The fundamental aspect of better than expected labour reports is mainly driven by implications for short-term interest rates. Strong employment reports suggest economic expansion in the future, increasing the probability of a restrictive monetary policy which pushes demand for US dollar assets relative to foreign assets.
As noted earlier, traders should also pay attention to the other labour indicators within the employment report to build a solid understanding about potential implications on the market.
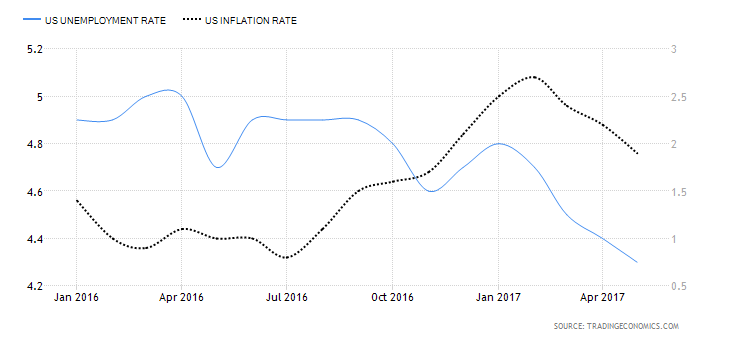
The unemployment rate also has a close relationship with the inflation rate. The reason for this is that an increase in household income often creates inflationary pressures in the economy. This relationship is often managed by policy makers, who can initiate a growing inflation rate by providing stimulus to lower the unemployment rate, or reduce the inflation rate by accepting slightly higher unemployment numbers. Traders can also use this inter relationship between inflation rate and labor data reports to try to position themselves in the market according to this relational assessment.
Inflation Rate
The inflation rate is also a major market-moving data point in the foreign exchange market. The inflation rate measures the change of prices in goods and services for a specific time period. Like the employment data report, it is one of the most widely watched and important economic indicators for FX traders.
Central banks, like the Federal Reserve, target a specific inflation rate to keep the economy healthy and growing. The Fed’s target inflation rate is around 2% for the US economy. That being said, a certain level of inflation is normal, but deflation or an extremely high inflation rate can be concerning and spark recession in an economy.
Traders and economists favor the implicit price deflators contained in the Gross Domestic Product report to get a picture of inflationary pressures in the economy, but that report is released only quarterly. More frequent reports are the Consumer Price Index (CPI) and Producer Price Index (PPI) reports.
Just like the employment statistics, the US Bureau of Labor Statistics also publishes the CPI and PPI reports. Both reports are published around the middle of month at 8:30 a.m. ET for the previous month’s data, the PPI usually one business day before the CPI. Among the scheduled economic news indicators for inflation, the CPI report has a slight advantage over the PPI report as it shows the price changes at the consumer level.
The Consumer Price Index (CPI) measures the change in price of a basket of a few hundred goods and services. The basket contains usual households’ expenditures on a monthly level, and each item’s weight in the basket reflects the percentage of total household expenditures.
The CPI report also contains sub-indices, which track price changes in energy, food, and all goods and services except food and energy. The last of these is especially influential in the forex market. It is also called the “core CPI”, as it removes the extremely volatile energy and food categories. The difference between the all-item CPI report, and the “core CPI” report is shown on the following chart.
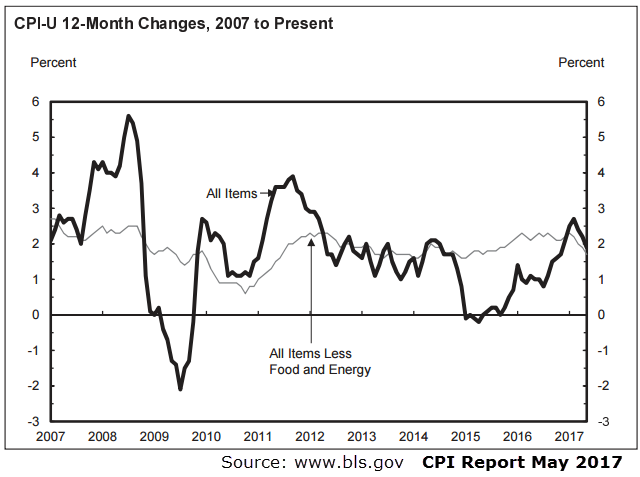
As can be seen on the chart above, the “core CPI” report is far less volatile than the all-items CPI report, and can be a valuable substitute for the all-items CPI in times when extreme oil price fluctuations would distort the actual inflationary picture of an economy.
The CPI release often creates quite a stir in the financial markets. Its importance is even more pronounced as central banks target a specific inflation rate, and adjust their monetary policies to achieve this target. A growing inflation rate as a result of positive economic conditions often requires a tightening in monetary policies to cool the economy down, which leads to an appreciating currency.
On the other hand, falling inflation rates require a looser monetary policy to spark inflation and avoid negative deflationary conditions. Japan, once an economic model in the 1970s and 1980s, slipped into deflation in the 1990s and 2000s. This period in the newer Japanese history is often called the “lost Japanese decade”.
Traders can also try to predict the CPI figures to get a head-up in the market. Rising material and commodity prices increase the cost of the final products, as prices of production inputs rise. This is known as cost-push inflation and can give a clue in which direction the inflation rate is heading. The producer price index (PPI) can be useful in this regard.
The producer price index (PPI) tracks the change in selling prices of around 3000 items at various stages of manufacturing. Components of the PPI, which is also called the wholesale price index, are weighted according to their share in the gross domestic product. Unlike the CPI, the PPI covers prices before the retail level is determined, and includes raw materials and intermediate goods. As the producer price index is released at least one day before the consumer price index, traders can get a feeling of how much inflationary pressures have traveled through the production process, and determine those effects on the retail sector.
Traders should keep in mind that the producer price index does not include the change of prices in services, which is a substantial contributor to the US GDP.
As the PPI does include the price of raw materials, which are very sensitive to weather conditions, their price can fluctuate significantly and create a very volatile PPI reading which differs a lot from the CPI readings. However, both indicators do show a high positive correlation over time and are used as a reliable means of analysis in the forex market.
Retail Sales Numbers
Another economic release to keep an eye out for on your forex economic calendar is the retail sales report.
The retail sales report presents the estimate of the value of sales for the retail sector and is released by the US Department of Commerce, around two weeks after the end of the record month at 8:30 a.m. ET.
The retail sales report is another key economic indicator in forex and can have a noticeable impact on the currency market. The reason for this is that the value of retail sales gives an insight into personal consumption, which in turn has the largest share in the gross domestic product (GDP).
As the retail sales figures are released monthly, it can provide clues for what to expect for the quarterly GDP report. Increasing retail sales typically equate to greater corporate profitability, which can lead to increasing investments and dollar-demand, causing the US Dollar to appreciate. Higher than expected retail sales are usually positive for the US dollar, while lower than expected retail sales cause the currency to fall.
To get a picture of how much customers spend, some analysts go to shopping malls and watch the customers’ spending behavior, or count the occupied parking lots in front of the malls during weekends. Holiday sales typically boost retail sales and can also give an insight into consumer spending. If people are feeling confident in their financial well-being and in their jobs, this will reflect in their spending behavior. Christmas, Thanksgiving, Easter and other holiday sales reports are therefore important to track, as they can give valuable information about the state of the economy when compared with previous retail sales figures.
Gross Domestic Product
Among all the financial economic indicators covered, the gross domestic product (GDP) is the most comprehensive indicator available of a country’s economic condition. It represents the sum of market value of all finished goods and services, produced in a country within a specific time period. For example, all cars that Toyota produces in the United States are counted into the US GDP. The ownership of resources do not impact the GDP value, as long as all products and services are produced inside the borders of a country.
The Bureau of Economic Analysis reports on the GDP quarterly. Each report goes through three stages: the advance report, the preliminary report and the final report.
The advance report being the first report to hit the newswires, has the most impact on the currency markets. This report is released around one month after the reporting quarter end – e.g. for the first three months of the year, the advance report is released in April.
After the Bureau of Economic Analysis makes necessary adjustments and refines the advance report, the preliminary report is released around one month after the advance report, i.e. in May for the first quarter of the year. The final report is then released one month after the preliminary report, and represents the final revision of the GDP for the reported quarter.
The GDP report is calculated using the aggregate expenditure approach:
GDP = C + I + G + (X – M)
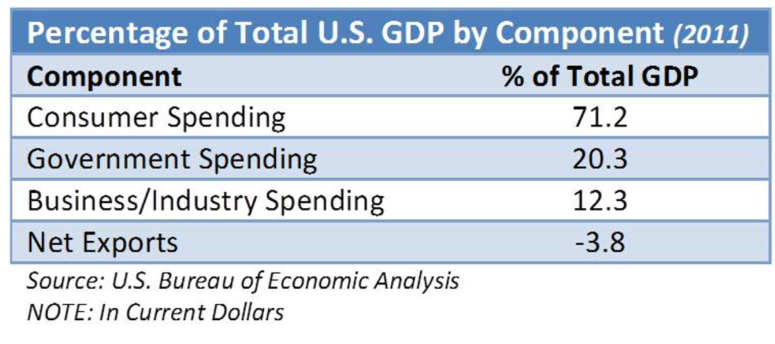
Where C is personal consumption, I is domestic investment, G is government expenditures and investments and (X – M) is the net export of goods and services. The share of each component does not vary widely from period to period, and personal consumption takes the largest share in the GDP of the United States with around 70%. The following table shows the US GDP by components in 2011.
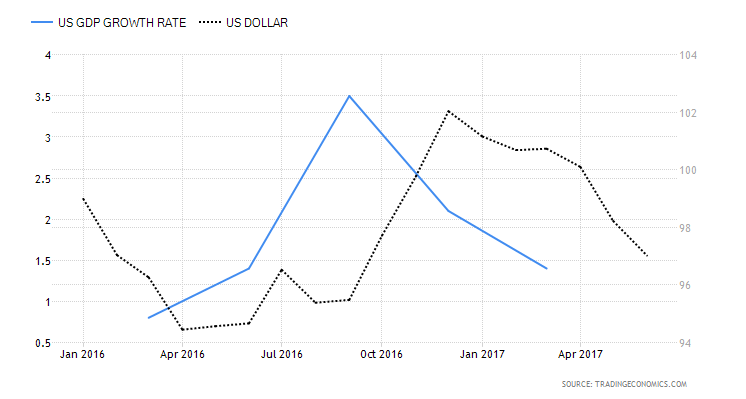
When trading the GDP report, traders should pay special attention to the advance report as it is the most market-moving release of all GDP reports. The usual impact on the currency market is positive for the domestic currency when GDP rises more than expected, and negative if it fails to exceed market expectations. The correlation between the GDP report and the US dollar is shown on the following chart.
In recent times, the impact the GDP report has on the currency market has slightly lowered. The reason for this is its frequency of release. Being a quarterly release, traders try to predict the GDP report by tracking leading indicators like personal consumption and the housing market. Still, the GDP remains the broadest indicator which gives valuable insight into a country’s economic condition.
Conclusion
The labor statistics, inflation rate reports, retail sales and the GDP reports are in the primary group of major economic indicators with a high impact in the currency market. Both the labor data and retail sales are leading indicators of the future economic conditions by which GDP growth rates can be predicted, and are widely used by traders to analyze the potential impact on exchange rates. The inflation rate, being an indicator of price changes in goods and services and targeted by the Federal Reserve, is also an indicator which traders should follow closely to increase their success rate in the market.
Although trading fundamental economic indicators can be tricky, with a little practice and experience traders can implement macroeconomic strategies, in addition to technical analysis to gain a major advantage over other traders.