There are numerous articles written about techniques that can be employed to take advantage of emerging trends. Less has been written about how a trader should approach range bound market conditions, which typically exist in most markets over two-thirds of the time.
And so in this lesson, we will take examine what a Range Bound market looks like and some trading strategies in this environment.
What is a Range-Bound Market?
A Range-Bound market is a condition where there is a price congestion within a range on the price chart. This means that the general price action is situated between two specific levels – the high of the range and the low of the range. Some traders refer to a Range Bound market as Price Consolidation, Congestion Phase, or Flat Market.
In simple terms, when a Forex pair is not trending upwards or downwards, it is ranging, meaning that the price is moving sideways within a horizontal channel.
The highest point within the price consolidation is considered a resistance area. Contrary to this, the lower price within the range is considered a support area. These two areas should to be considered as a zone rather than as a fixed horizontal price. The high and the low points of the horizontal channel helps us visualize the state of the current range for the currency pair.
These types of Ranges in Forex can appear regularly, however, they tend to occur often during low trading volume periods. Since the volumes are low the bears and the bulls cannot overpower each other, creating a flat price action.
Take a look below to see how a Range-Bound market appears on the price chart:
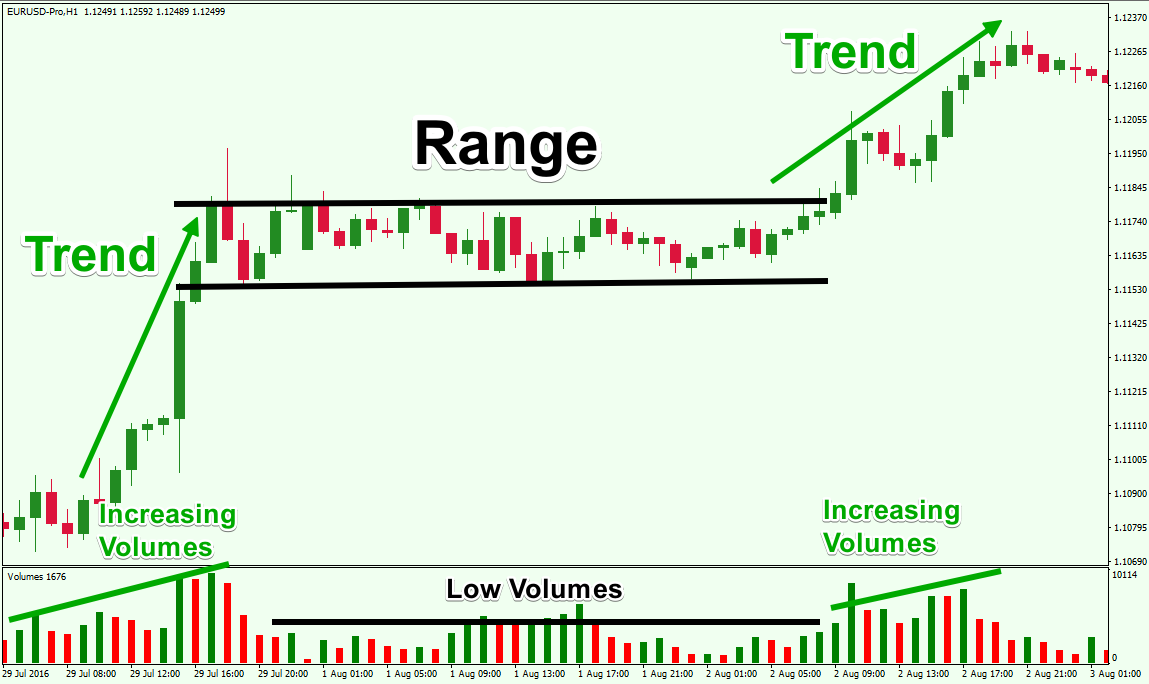
Above you see an image showing a classical Range example. The chart covers the period Jul 29, 2016 – Aug 3, 2016 on the EUR/USD Forex pair.
You will notice that the EUR/USD is trending when the volumes are increasing. Contrary to this, the price is moving sideways when volume readings are lower.
Pros and Cons of Trading Range Bound Forex Pairs
Forex price ranges can be tricky to trade; there are some advantages and disadvantages in trading ranges. Below we will discuss some pros and cons of the Range Bound currency trading.
Pros for Trading Ranges
Clearly Stated Levels For Trading Inner Swings – When you have a range on the chart, you have a clearly stated high and low of a horizontal channel. This means you know when to expect a likely price bounce in the opposite direction.
Getting In Early on a Potential Trend– When a valid breakout occurs out of a range, you can seek an extension of the price move. Trading the initial breakout can offer a very desirable Reward to Risk ratio and turn out to be quite profitable when the breakout extends into a sizable impulse leg.
Cons for Trading Ranges
Low Trading Volumes – Tight trading ranges tend to occur frequently during the absence of sufficient trading volumes. This means that the market pressure is weak and neither the bulls nor the bears could gain dominance. As such a breakout may not occur or it is does, it can be considered suspect.
Absence of a General Trend – Since bears and bulls cannot overpower each other, we have a flat price action on the chart. This means that there is no existing trend that can be traded.
Price Uncertainty – Price is very uncertain during Range Channels. The reason for this is the low trading volumes, which can often lead to false breakouts and whipsawing price action.
Market Range Breakout
One of the most powerful occurrences during a flat price action is the Market Range Breakout. This phenomenon occurs when the price action breaks through the upper, or the lower level of the Price Range.
A Range Breakout means that the price action is attempting to continue the current price move in the direction of the breakout. In this manner, we expect an extension of the current range swing. In many cases, after a High Momentum Range Breakout the price enters a new trend in the direction of the break.
Below you will see a valid Market Range Breakout to the upside and the resulting bullish move:
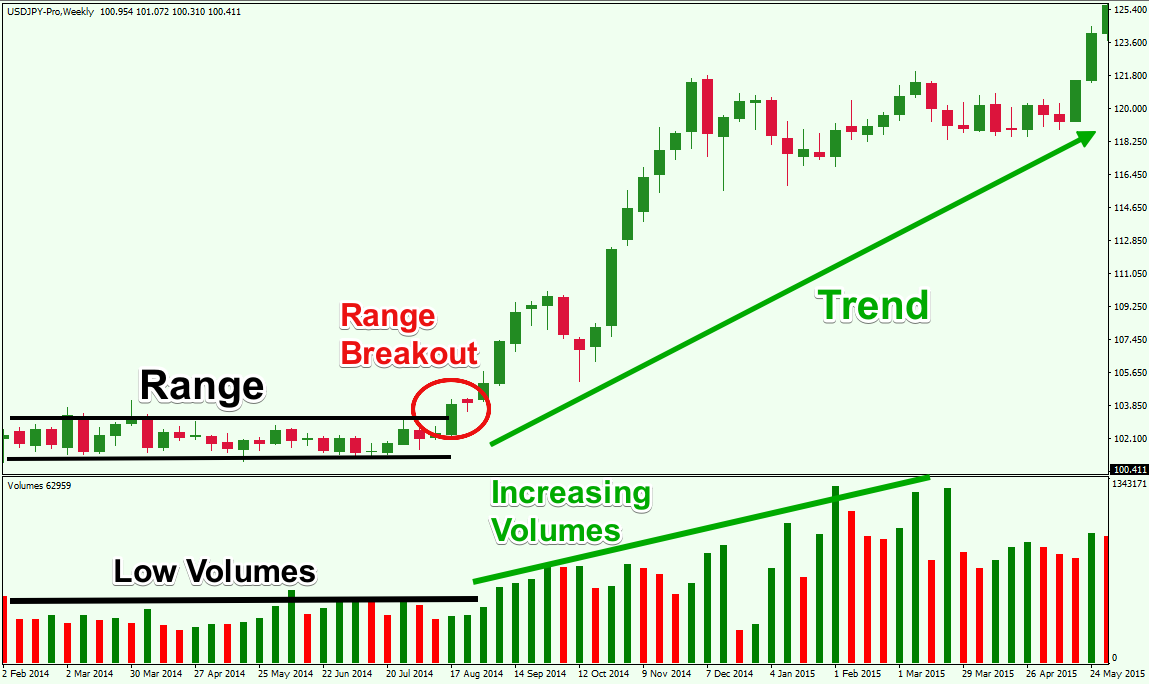
Now we are looking at the weekly chart of USD/JPY Forex pair. The graph covers the period between Feb, 2014 and May, 2015. The black lines on the chart illustrate the flat price action, with the pair moving in a Range channel. The range occurs during a relatively low volume.
In the red circle we spot a Range breakout with a strong momentum candle, which hints that the price is likely to increase further. Shortly afterwards, volume begins to increase as well, and the pair starts a strong bullish trend, which lasts for more than 9 months.
Price Action Trading in Range Bound Currency Pairs
Many price action traders can trade Range Bound markets quite effectively. The reason for this is that the range itself can provide many price action clues for the informed trader. And combining the support and resistance zones within the Range with other events on the chart can provide for high probability confluent trades.
Trading Inside Price Swings
One opportunity we can explore from tight ranges is trading the inside swings during the flat market. We would attempt to enter a trade whenever the price bounces from the upper or the lower level of the horizontal channel. The position needs to be in the direction of the bounce. Then the trade would typically be held until the price action reaches the opposite side of the range.
This trading strategy benefits from the usage of a tight stop loss order. The optimal place for your stop loss order is beyond the level, from which the price action bounces from. Below you will see a trading example of the Inner Swings range bound trading strategy:
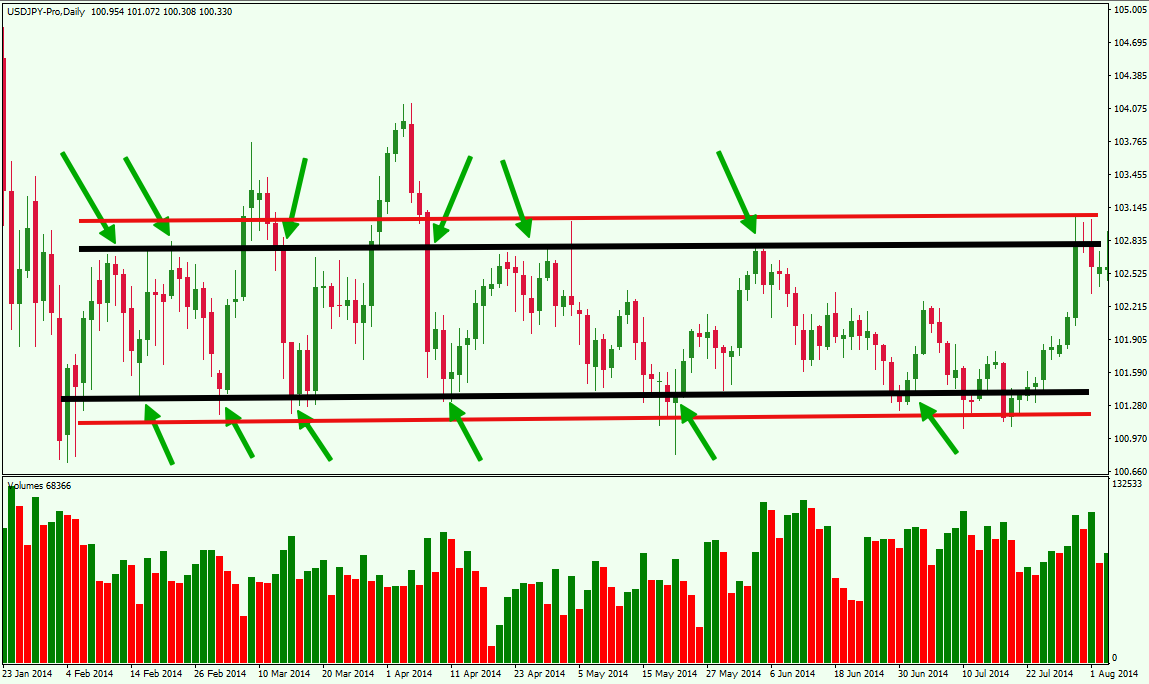
Let’s use the same USD/JPY range example from before. However, this time we visualize the range through the daily chart of the pair. The black lines display the high and the low of the range. You will notice that a couple of times the price action moves strongly above the range, but eventually reverts back. This type of pattern sometimes occurs after an economic news release.
We want to focus on the range levels where the tops and the bottoms are concentrated. The green arrows show the moments when the market presents buy and sell opportunities for the USD/JPY pair based on the range bound price action. The red lines display the levels of your stop loss orders in relation. When you open this type of bounce trade, you should hold it until the price reaches the opposite level, or until the stop loss order is triggered.
This Range trading approach is considered a risky initiative. One reason for this is the absence of decent trading volumes during the range. This leads to price uncertainty as the pair could rapidly change its direction if a bigger buyer or seller suddenly hops in the market.
Range Breakout Trading
The Range breakout trading approach is another way to profit from a ranging market condition.
The idea of this range trading strategy is to enter the market if the price creates a breakout through the upper, or the lower level. You would enter the market in the direction of the breakout. If the breakout is bearish, you sell the currency pair. If the breakout is bullish, you buy the currency pair. You enter the deal on the assumption that the price is likely to create a trend after breaking out of the range.
A valid Range breakout trading signal is accompanied by high or increasing trading volumes. In this manner, you can use the Volume Indicator to confirm that the signal you get on the chart is a real breakout.
When you trade the Range breakout, you should always use a stop loss order. Sometimes the prices will close with a few candles beyond the levels of the range, but then the price will quickly return back inside the range. As such, you always want to be protected by a stop loss order.
I typically like to place the stop right in the middle of the range, and pursue a target at least equal to the size of the range itself. This way I can achieve a Reward to Risk ratio of at least 2:1 on this type of trade setup.
If the price completes the size of the range, you can consider keeping a portion of your position open. In this case you would want to use basic price action rules to get your final exit signal from the trade.
Below you will see how to trade Range breakouts based on some of the guideline provided:
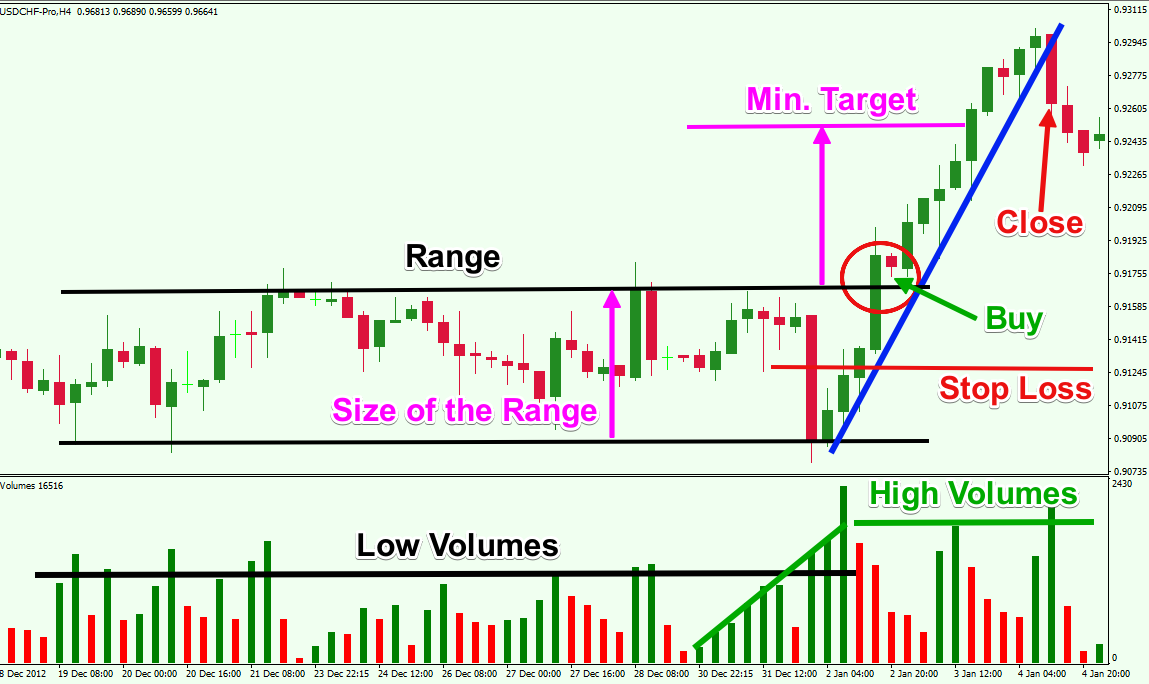
Here we are viewing the H4 chart of the USD/CHF a.k.a. the Swissy. The image covers the period between the last week of Dec, 2012 and the beginning of Jan, 2013.
Again, the range is marked with the black horizontal channel on the chart. The red circle indicates a breakout through the upper level of the range. This is when we would buy the USD/CHF pair. At the same time, we need to place a stop loss order in the middle of the range as shown on the image.
Then we measure the size of the range, which is shown with the first magenta arrow and we apply it as our minimum target as shown with the second magenta arrow.
After the strong breakout, the price action reaches the minimum target. We measure the bullish move with the blue trend line on the chart, and can use that price action reference point to exit the trade, if we still have a portion of the position open at that time.
We would want to close the trade completely when the price action breaks the blue trend line in bearish direction.
This breakout trading strategy is commonly used among price action traders, and can be adjusted to meet your particular trading style.
Useful Indicators to Identify Non Trending Range Market
There are some technical range indicators that are very helpful in recognizing flat markets. Let’s take a look at some of these now:
ADX Indicator
The Average Directional Movement Index (ADX) is a technical indicator which helps to distinguish trends from flat price movements. The indicator consists of a single line, which fluctuates from 0.00 to 75.00. If the line is located below 25.00 this indicates that we are probably in a Range Bound Market Condition. When the ADX value crosses above 25.00 from below, this indicates that the price is likely entering into a trend phase – bearish or bullish.
You might enter a trade when the ADX line breaks the 25.00 level supported by increasing trading volumes. We would enter the market in the direction of the price move. Again, we need to place a Stop loss order in the middle of the range. Then we need to hold the trade at least until the minimum target is reached. Of course we can always use the price action rules to extend our profit beyond the minimum target level.
This is an example of how the ADX indicator could be utilized in a Ranging market scenerio:
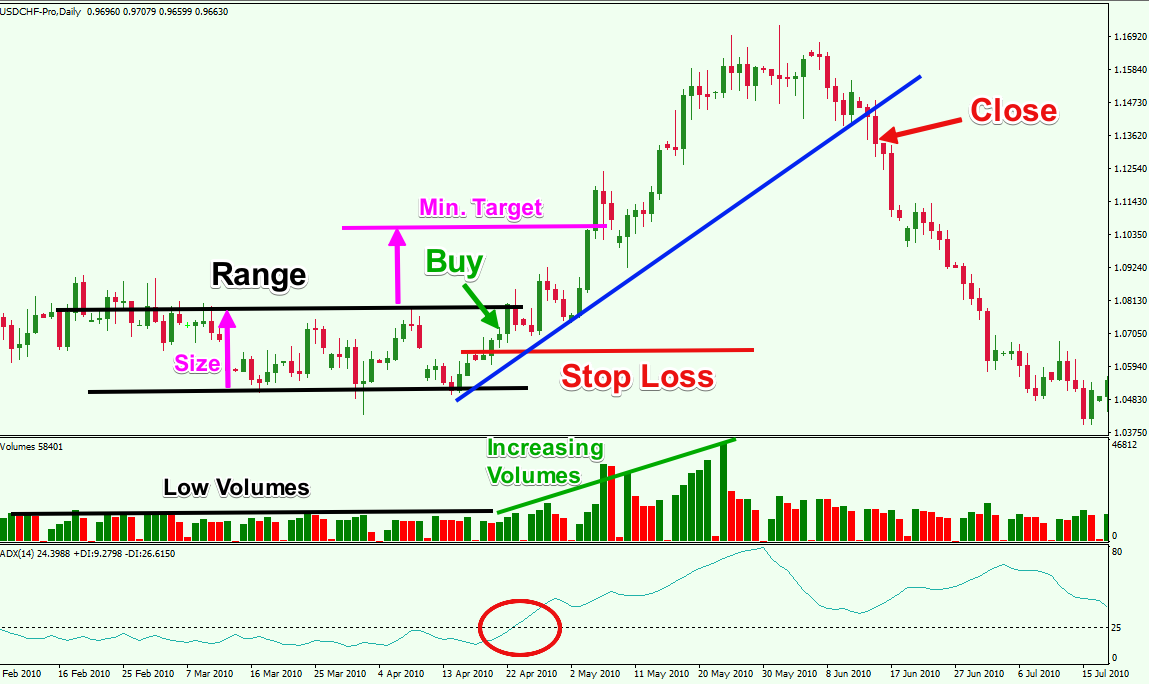
This is the USD/CHF chart again, but this time we cover the Feb 2010 – Jul, 2010 time frame. We have attached the Volume Indicator and the ADX Indicator below the chart.
The black lines illustrate a Forex Range during low trading volumes. Notice that during most of the Range, the ADX line is located below 25.00. We could look to enter a trade when the ADX line switches above 25.00. This would hint that the Range is probably finished and the price is likely to enter a new trend. Volumes should be increasing as well.
But in which direction should we enter the market? Here, the Volume Indicator could be of help as well as the natural price action. In our case the Volume Indicator closes big green bars, which means that the trend is bullish. At the same time, the price action is bullish as well. As such, we would look to buy the USD/CHF Forex pair.
Our stop loss order would to be placed in the middle of the range per the outlined trading rules presented earlier. Then we need to hold the trade at least until the Swissy reaches the minimum target (second magenta arrow). Alternatively, we have the option to hold the trade for further gains. See that the volumes keep increasing after the minimum target is reached. At the same time, the price of the USD/CHF pair remains intact within the blue bullish trend on the chart.
We can use the bearish breakout through the blue bullish trendline in order to close the trade.
Bollinger Bands
The next indicator which can help to distinguish Ranges from Trends is the Bollinger Bands. The Bollinger Bands is a volatility based indicator. It consists of two bands, which go through the tops and the bottoms of the price action, creating a channel, and a 20-period Simple Moving Average in the middle.
The price action dynamics are contained by the Volatility bands. Low volatility is usually caused by low trading volumes. High volatility is usually pressured by higher trading volumes. Therefore, the Bollinger Band indicator is useful in identifying Ranges and trends.
When the two Bollinger Bands are tight, then volatility is low and the market is quiet. When the two bands start expanding, then volatility is high and the market is moving.
This is how a Bollinger Bands range trading system could work:
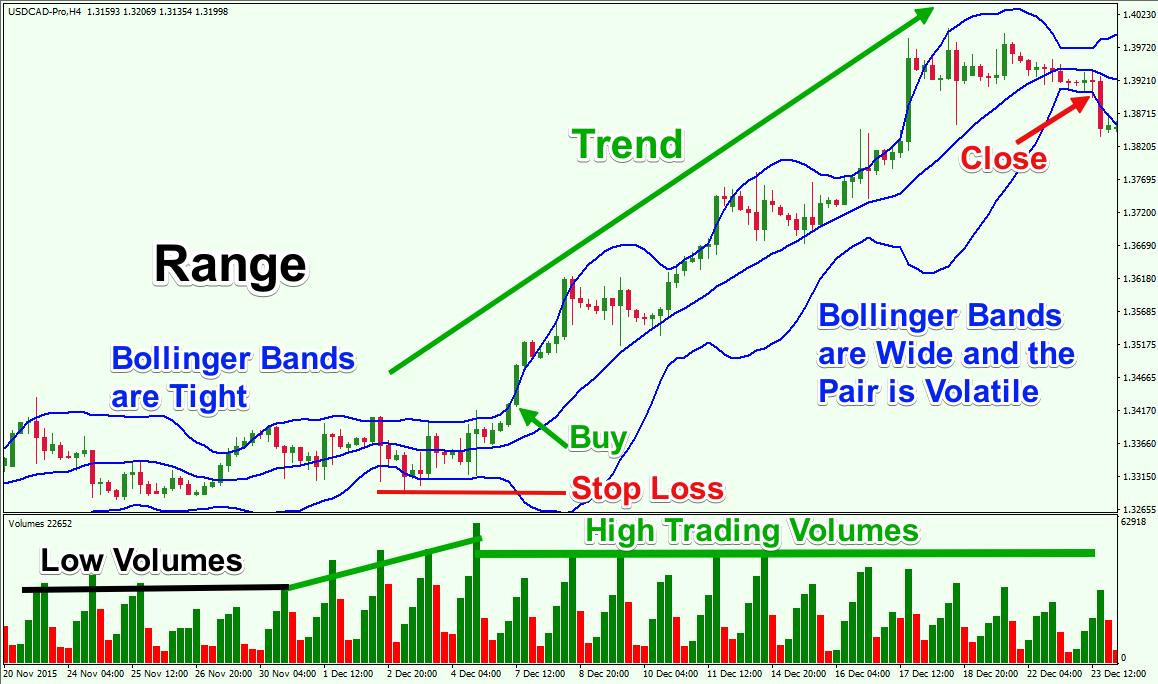
This time we do our Range analysis on the H4 chart of the USD/CAD Forex pair. The graph covers the period between Nov 20, 2015 and Dec 23, 2015.
The blue lines on the chart are the Bollinger Bands. See that when the bands are tight the price of the USD/CAD is ranging. When the bands expand, the price enters a trend. Also, when the bands are tight, the Volume tends to be low. As the bands expand, the Volume increases and becomes higher, which provides confirmation for the trend.
In the example above, We would look to buy the USD/CAD when the price action breaks the upper band as noted on the price chart, while both bands are expanding. The bullish signal is confirmed by the increasing volumes.
Our stop loss order needs to be placed below the bottom created prior to the increase as shown on the image. We would stay in this trade until the price action breaks the lower Bollinger Band in the bearish direction.
Conclusion
- A Range-Bound market is a period of price consolidation where the price action experiences sideways movement.
- When the price of a Forex pair is not trending, it is said to be ranging. In general, Markets tend to range approximately two-thirds of the time and trend less than one third of the time.
- The advantages of trading in a Range Bound market include:
- The Range has clearly stated levels.
- You can get in early on a Trend when the price breaks beyond the range.
- The disadvantages of trading in a Range Bound market include:
- When the Forex pair is ranging, we have no trend, which could be traded, and we may experience false breakouts and whipsawing price action.
- Also, the price action is accompanied by low trading volumes which makes gauging market direction more difficult.
- The Range breakout trade setup occurs when the price action breaks the upper or the lower level of the consolidating range.
- Two price action Range trading strategies typically used by traders include:
- Inside Swings Trading
- Range Breakout Trading
- Two indicators that assist in identifying trading ranges are:
- Average Directional Movement Index (ADX Indicator)
- Bollinger Bands Indicator