Before allocating any money in the markets, a trader needs to decide on the trading timeframe that they will be focusing on. This should be clearly spelled out within each individual trader’s business plan. There are three primary types of trading time horizons that can be implemented– long term, intermediate term, and short term. Today we will focus on the short-term trading timeframe and strategies.
What is Short Term Forex Trading?
Short term is a relative term. Short term for a position trader could mean weeks. In contrast, short term to a scalper could mean less than a few minutes. In this article, we will define short term Forex trading as day trading, which involves the opening and closing of Forex trades within a 24-hour trading session.
A short-term currency trader typically aims for small to moderate gains but initiates a large amount of trades over a specified period. Many short term traders feel that they can take better advantage of their “Edge” by relying on the large sample size that can be produced by frequent trading. The more trades that the short-term Forex trader implements, the closer he can get to his perceived “Edge”over time.
Let’s take a look at this a bit closer. For example, if your strategy has a 60% win rate, then there is a 40% chance that every trade will be loser. Based on this Win Loss ratio, it would not be unheard of to get four, five, six or more consecutive losing trades. The reason for this is that the distribution of your wins and losses can take many forms within that 60-40 Win Loss profile. Short term traders typically have a large frequency of trades which helps them to counter-balance the effects of these types of multiple losses quicker than longer term traders.
Short Term Trading Timeframes
The most popular short term time frames for Forex trading are M30, M15, and M5 and M1. As a short term trader, you need to make sure that your data provider is giving you real time intraday data and not delayed or end of day data.
The lower the time frame you work with the more granular you can get and the more candles you will see within the daily data. For example, within a day, you will get six 4-hour candles, twenty-four M60 candles, forty-eight M30 candles, ninety-six M15 candles, and two hundred eighty eight M5 candles.
Short Term Forex Traders
As we have defined earlier, a short term Forex trader is one who conducts his trades intraday and closes out their position within a trading session or a 24 hour period. A short term currency trader will typically open multiple trades aiming for relatively small profits from each trade. Successful short term Forex traders have back-tested their trading strategies, either manually or thru computerized back-testing software. The goal of many short-term day traders is to produce a steady monthly income based on the implementation of their strategy in the market.
Best Short Term Trading Strategies
Now that you are familiar with the short term trading concept, we will discuss three trading strategies for implementing trades within this timeframe. We will use smaller time frame charts to illustrate the approaches and the trades will be discussed at the intraday level to demonstrate the full short term trading experience.
Short Term Support and Resistance Trading
Support and resistance trading is one of the best ways to approach the Forex market in the short term. The idea behind this technical approach is to look for important levels on the chart and to trade a breakout from the levels. If the price action breaks a support level downwards, you should open a short trade. If the price breaks a resistance level upwards, then you should engage in the market with a long trade.
The risk management rules of this trading strategy are very easy and straight-forward. Simply put a stop loss order beyond the level, which you are trading. For example, if you trade long after a resistance breakout, you should place a stop order below that resistance level. If you are trading short after a support breakout, you should put a stop above that support area.
You should use price action rules to determine your optimal exit from the trade. With a short term trading approach, you want to get out of the trade quickly, and make sure you are not turning your short term trade into some sort of longer term position.
This may seem obvious, but it is a very important concept to understand. Sometimes knowingly or unknowingly, short term traders let their position get out of control, usually when they are losing. And when this happens a trade that was supposed to be limited to a daily session, has now turned into a big losing trade which the “short-term” trader is still holding after a week or longer. So, know the timeframe you are trading and make certain you are placing your stop loss and take profit within your intended trading timeframe.
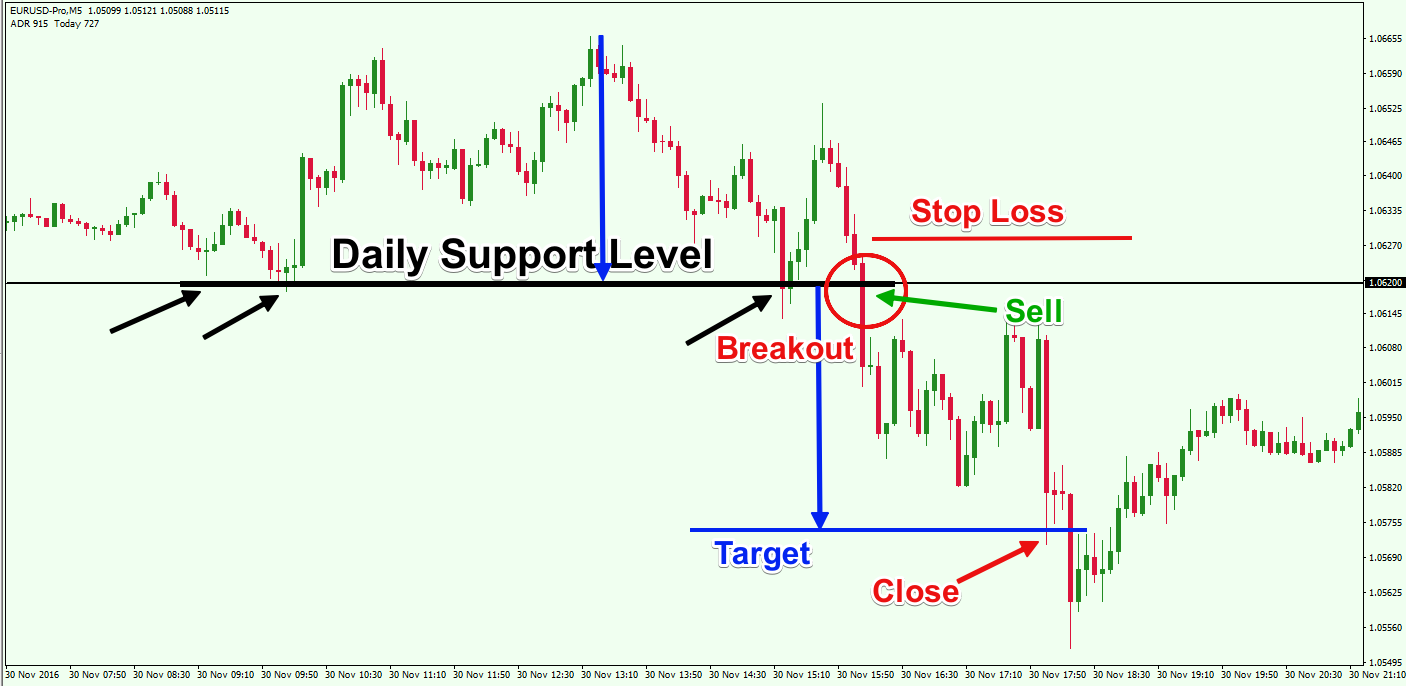
We are looking at the M5 chart of the EUR/USD for November 30, 2016. The image suggests a trade taken based on a daily support breakout.
The support level is located at $1.0620, and it has been tested three times. Each of the three tests is noted with the respective black arrow on the chart. On the last attempt, when the price action interacts with the $1.0620 support, we see a strong bearish bar, which indicates a bearish breakout.
This is a short-term signal to sell the EUR/USD based on a breakout in the daily support level. If you decided to trade this opportunity, you would need to protect your trade with a stop loss order. The proper place for your stop would be a bit beyond the broken support. The red horizontal line on the chart suggests an appropriate location for the stop loss order.
The EUR/USD price drops afterward. In this case, we can use a fixed target on the chart. Notice the two tops above the daily support level. These tops are located at approximately the same level. Therefore, we can use the distance between the daily support and the level of the two tops to apply a reasonable scope for the potential price decrease. The two blue arrows show how we measure that distance and then apply it starting from the broken support line.
You should close your trade when you see the price action reach this level. Notice upon reaching this level, a reversal appears shortly afterward.
Short Term Trend Trading
The next strategy we will discuss for the short term horizon is trend trading. This strategy involves catching intra-day trends and riding them until exhaustion. In addition to this, when an intraday trend gets interrupted, you can consider opening a trade in the direction of the new breakout.
The rules of this short-term trend trading strategy are simple. If you see a Forex pair bounce from the same trend line for the third time, then we will assume that a trend is likely emerging and look to trade the pair in the direction of the emerging trend impulse.
This trend line trading approach requires the usage of a stop loss order for protecting your trade. Your stop should be located beyond the third bounce swing, which you use to open the trade. Then as the price moves in the intended direction of your trade, you can manually adjust the stop loss order, so that it will be tight under the trend line. You should hold your trade until the price action breaks the trend line.
When the breakout appears, you should close the trade. This will create another opportunity on the price chart, which is in the direction contrary to your previous trade. Now you can trade the market in the direction of the breakout. There are some additional details and rules that should be followed when you trade trend breakouts. Firstly, when the price breaks the trend line, you should first wait for a pullback. Then you can enter the trade when the price action breaks the swing created after the trend breakout.
This time the stop loss order should be located in the middle of the distance between the top of the trend and the first bottom outside the trend. At the same time, you should hold your trade for a minimum price move equal to half the trend size.
On the chart above, we are analyzing the 1-minute USD/JPY Forex pair for January 9, 2017. The image on the left side of the chart shows a bullish trend emerging in the pair.
The trend is marked with the yellow bullish line on the chart. The two black arrows you see at the beginning of the chart mark the two bottoms we use to build the trend line. The green arrow marks the third bounce, which is a short term signal in the bullish direction. We need to place a stop loss order right below the swing bottom created as shown on the image.
As you can see, the price shoots up quickly afterward. There are four more bullish impulses on the way up. The last three of these impulses are relatively big, compared to the initial trending legs. You can adjust your stop loss upwards so that it will always be tight below the trend.
You would want to close the trade at the moment when the price action breaks the trend line downwards. This is shown in the red circle on the trend line.
See that after breaking the trend line the price creates a bottom, marked with the black horizontal line. This level should be used to short the USD/JPY if the price breaks it downward. If the price moves below this first bottom, then this is a strong reversal indication. Note that the price action creates one more test of the black horizontal level before breaking it.
After the breakout through the first bottom outside the trend, you have the opportunity to short the USD/JPY on the assumption that the trend is reversing. At the same time, you should place a stop loss order right in the middle of the distance between the top of the trend and the black line indicating the first bottom outside the trend.
Then you could hold the trade for a minimum price move equal to half the size of the previous bullish trend. The size of the trend is marked with the long blue arrow. The smaller blue arrow measures half of the trend. You should close your trade at the moment when the price action reaches the distance equal to half the size of the trend.
Short Term Trading with Candle Patterns
This is another trading strategy which is commonly used by short term Forex traders. This strategy involves scalping the market using candle patterns. The chart timeframe we will be focusing on are the M1, M5 and M15.
For this strategy, you would be looking for reversal candle patterns on the chart, and enter in the direction indicated by the specific candle pattern. Your short term candle pattern signal comes when the price breaks through the level marking the tip of the candle pattern.
You should protect each of your candle scalp trades with a stop loss order. A good place for your stop would be the level at the opposite side of the candle pattern you are trading, including the candlewicks.
After you enter the market on a reversal candle pattern, you should hold the trade for a minimum price move equal to the size of the candle pattern. This means that you should be taking the distance between the candle’s low at the lower candlewick and its high at the upper candlewick.
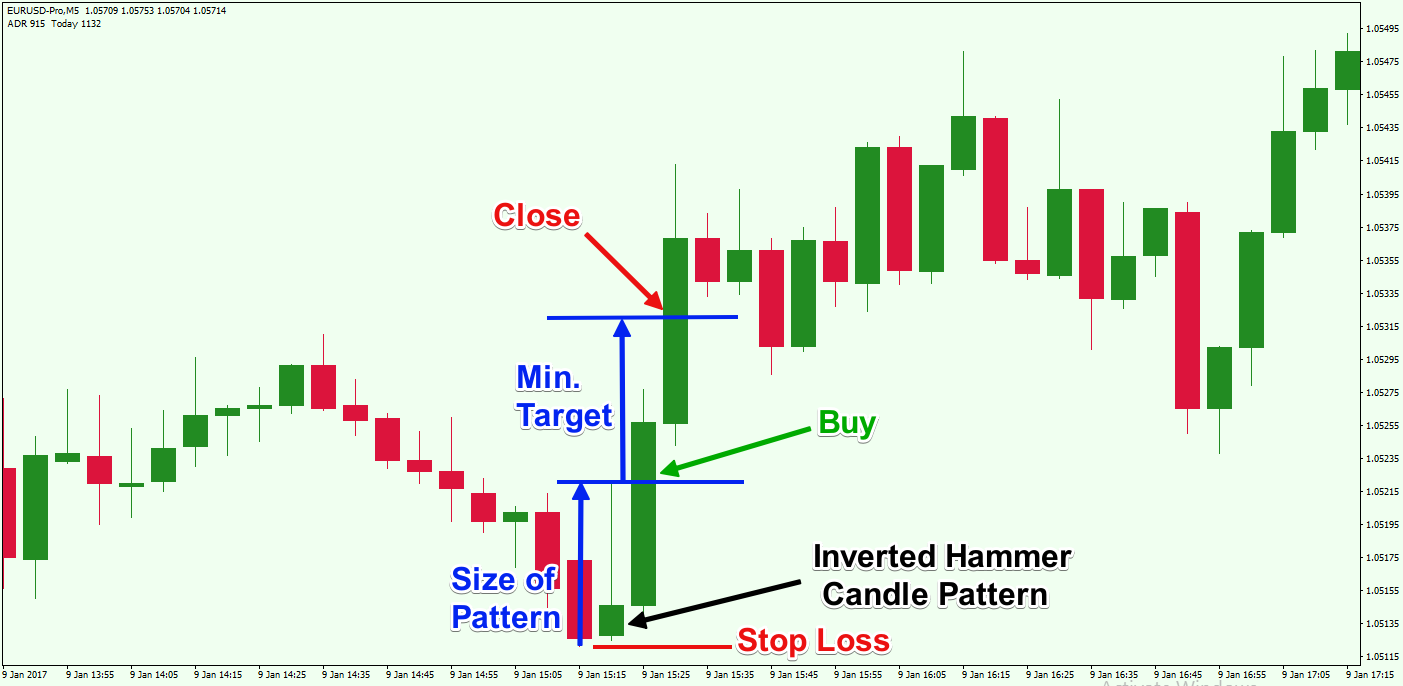
Above you will see an example of how to scalp a candle pattern. This is the M5 chart of the EUR/USD for January 9, 2017, and the pattern we are looking at is an Inverted Hammer.
You could buy the EUR/USD pair when the price action breaks the upper level of the Inverted Hammer candle. Then you would place a stop loss order below the lower candlewick of the candle as shown on the image.
The blue arrows measure and apply the size of the Inverted Hammer. Your target is located at the top of the upper blue arrow. You would close the trade when the EUR/USD reaches this level. This is a quick strategy to setup. Speed is of essence when trading short term patterns like these.
Now let’s analyze another candle pattern example:

This time we are viewing the 5-minute chart of the GBP/USD for January 3, 2016. The candle pattern we demonstrate is the bullish Harami, located in the black rectangle on the chart.
You could buy the GBP/USD pair when the price action breaks the upper level of the bullish Harami. This is an indication that the previous bearish price action is likely to reverse. You would place a stop loss below the pattern as shown on the image. This way your trade will be protected in case the price moves against you. You would look to hold the trade for a minimum price move equal to the total size of the bullish Harami. The target is measured and applied with the blue arrows on the image. Whenever the price action reaches the distance equal to the size of the Harami, you would exit the trade. This bullish Harami trade setup lasted for about 40 minutes.
Conclusion
- Short term Forex trading typically involves trading strategies, which are open and closed on the same trading day.
- Short term traders aim for relatively small gains but have a large frequency of trades.
- Short term trades are taken on smaller timeframe charts such as M30, M15, M5, and M1.
- Scalp trading is ultra-short term and involves trades that can last just minutes.
- Three popular short term Forex trading strategies are:
- Short Term Support and Resistance Trading: You aim to trade breakouts from key levels. You would open your trade in the direction of the breakout placing a stop beyond the key level. You should use price action rules to determine your exit point on the chart.
- Short Term Trend Trading: You try to hop into emerging trends. One way is by using a trend line tool and placing a stop below the trend line. You would trail the stop as the price moves in your direction. You stay in the trade until the price breaks the trend. You can also trade the trend breakout. For the trend breakout, you would aim for a price move equal to half the prior trend move.
- Short Term Candle Pattern Trading: You would scan the chart for reversal candle patterns on small time frames (M15, M5, and M1). When you find a reversal candle pattern, you open a trade after the price breaks its high/low level in the expected direction. You put a stop at the opposite side of the pattern and hold the trade until the size of the candle is completed as a distance starting from the moment of the breakout.