Technical indicators and oscillators are popular among forex traders for currency analysis . Forex oscillators can assist the trader in discovering market extremes and turning points on the chart, sometimes even prior to the actual reversal in price.
Learning how to correctly apply and analyze various technical oscillators can help you to improve your trading results.
What are Technical Trading Oscillators?
A technical oscillator provides a visual representation of a mathematical algorithm that takes into consideration the price data on the chart. The oscillator typically has two opposing extreme levels which can be used as a gauge for an overbought or oversold market condition in the instrument being analyzed.
Price oscillators can be categorized as leading indicators. The reason for this is that they can provide an early warning or signal about a potential price event on a chart. In this manner, they are very useful tools for traders looking at trading price extremes or retracements within a trend.
There are however some downsides with technical oscillators. Oscillators can be prone to giving many false trading signals prior to the actual price event. This is in contrast to the lagging indicators, such as moving averages, which are somewhat more reliable, but their signal tends to come with a longer delay.
Now let’s take a look at how a Forex oscillator will typically look on your chart:
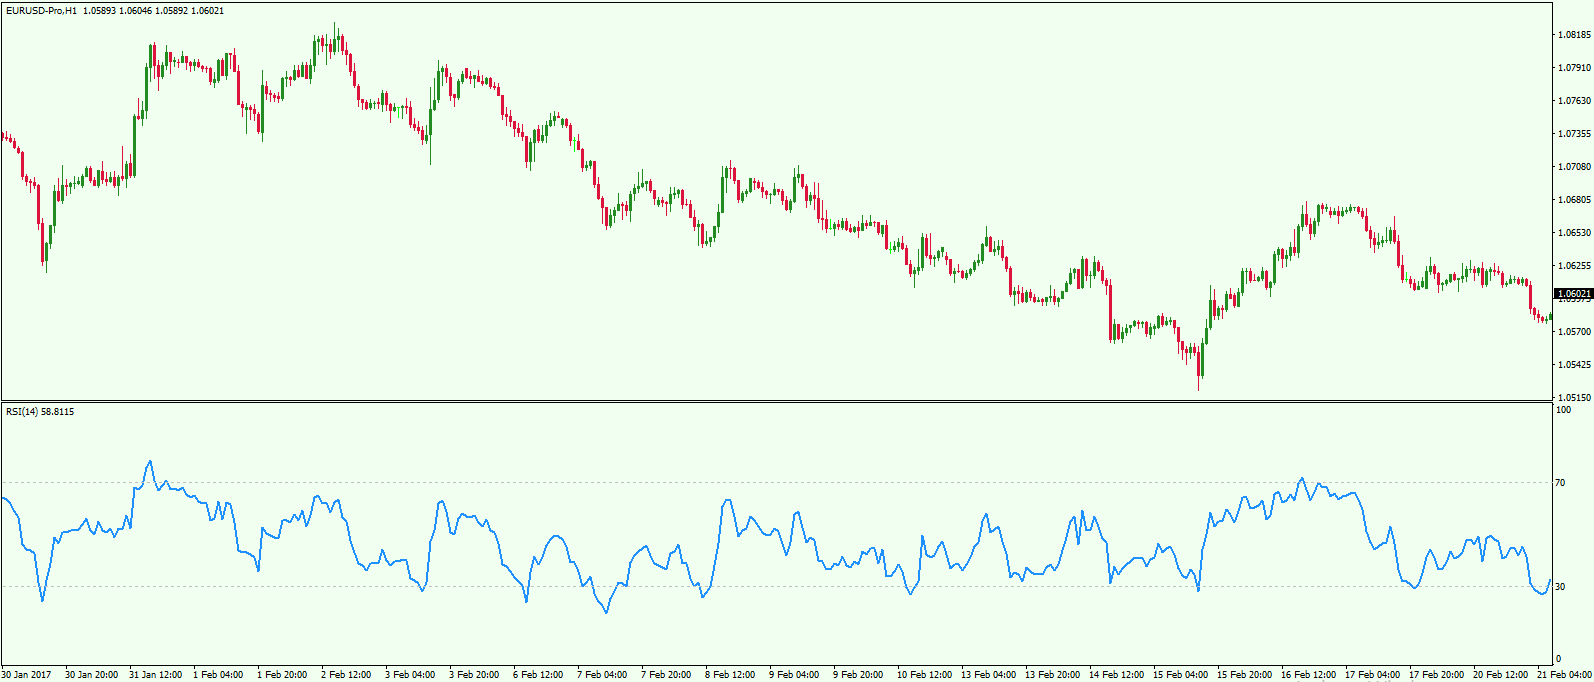
This is an example of a trading oscillator called Relative Strength Index (RSI). The tool usually attaches to the bottom of your chart and represents a line fluctuating between 0 and 100. The signal attained depends on the position and reading of the line value within this area.
Basic Oscillator Strategy in Forex
The basic idea behind using Forex oscillators is to get early buy and sell signals – overbought and oversold signals more specifically. Oscillators can warn you when prices are being pushed too far in one direction. And when this occurs, we can expect a rubber band type effect, wherein prices snap back or begin to revert towards the mean.
Oscillator Buy Signal
A basic oscillator buy signal comes when the indicator is showing an oversold reading. This means that there may be too many sellers in this market and you are looking at a possible bearish market extreme. As such, an oversold oscillator signals a potential upward turning point on the chart.
Oscillator Sell Signal
The opposite is true of an oscillator sell signal. This signal comes when the oscillator is overbought, meaning that there may be too many buyers in the market pushing it to a bullish extreme. As such, the oscillator signals a potential downward turning point on the chart.
Oscillator Divergence
One of the best ways to incorporate oscillators into your trading plan is by using it in conjunction with Divergence patterns. Generally, you have a divergence when the oscillator and the price action are moving in different directions. A trade is typically taken in the direction of the oscillator.
Bullish Divergence
You have a bullish divergence when an oscillator is creating higher lows, and the price action is creating lower lows. This is a signal for a potential bullish price move on the chart. A long position would be taken with a bullish divergence pattern on the assumption that the current price action is losing momentum and due for a change in direction to the upside.
Bearish Divergence
The bearish divergence comes when the oscillator is creating lower highs, and the price action closes with higher highs. This is a signal for a potential bearish price move on the chart. A short position would be taken with a bearish divergence pattern on the assumption that the current price action is losing momentum and due for a change in direction to the downside.
Best Indicators and Oscillators
Now that understand the basic idea behind this type of technical study, we will discuss some of the best technical indicators and oscillators for Forex trading. If you have no prior oscillator training, I believe this will serve as a good introductory lesson that will teach you the core concepts you need to get started.
Relative Strength Index
The first oscillator we will discuss is the Relative Strength Index, also known as RSI. The RSI consists of a single line that moves between the 0-100 area with the two default levels of 30 and 70.
The 0-30 is the oversold zone that gives the oscillator buy signals. The 70-100 area is the overbought zone that generates oscillator sell signals.
The calculation of the RSI line involves two formulas:
Relative Strength (RS) = Average Gain / Average Loss
and
RSI = 100 – [100 / (1+RS)]
The default 14-period value of the RSI suggests that the Average Gain and the Average Loss are calculated by taking into consideration 14-periods on the chart. You calculate the average of all gains (price increases) on the chart during the last 14 periods. Then you do the average of all the losses (price decreases) on the chart during the same 14 periods.
After you find the RS, you can complete the RSI formula.
The RSI Indicator is excellent for divergence trading. There is a bullish divergence when the RSI creates higher bottoms, and the price action creates lower bottoms. The bearish divergence comes when the RSI closes lower highs, and the price action sets higher highs. Remember, the concept behind divergence is to take advantage of the current waning momentum which is likely to lead to a potential reversal.
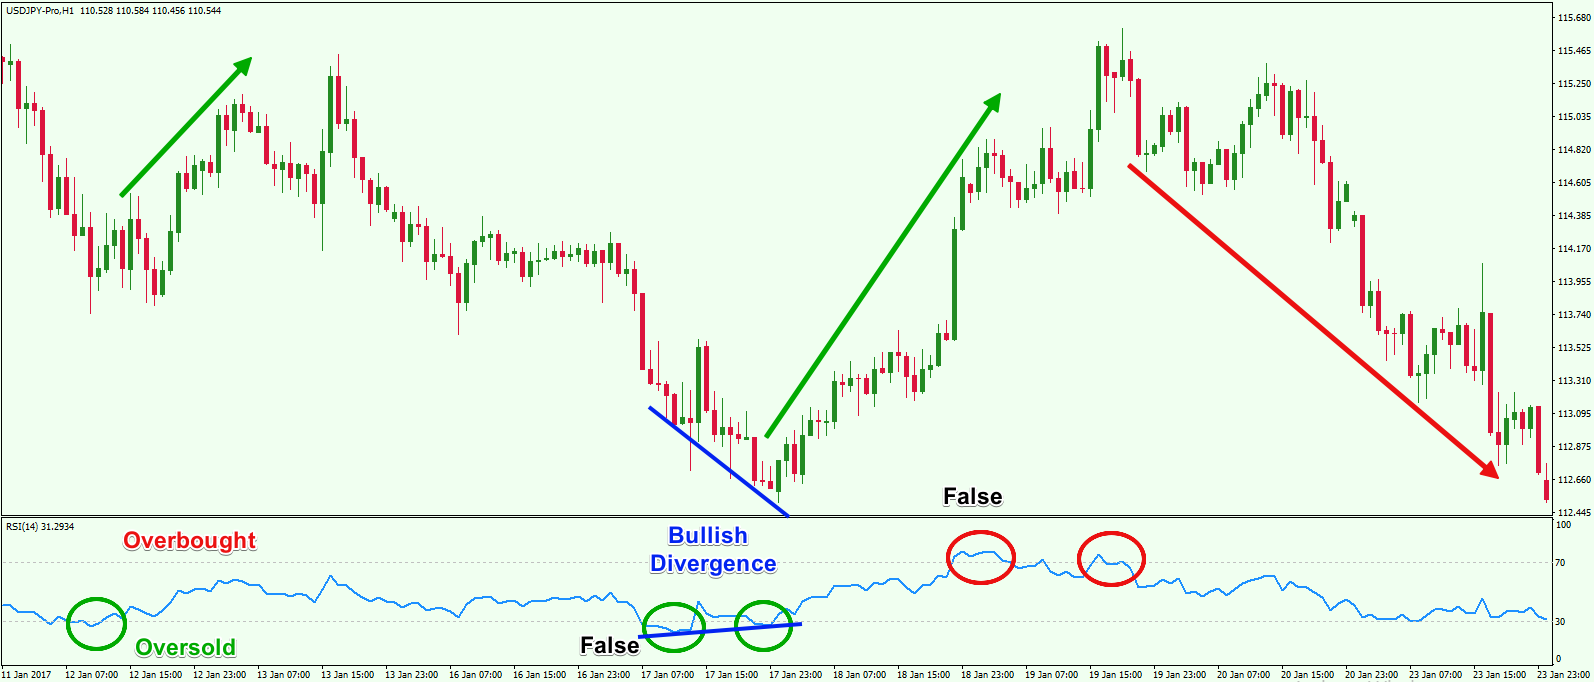
The chart you are looking at is the H1 of USD/JPY. The image shows the RSI oscillator attached at the bottom.
We have a few signals coming from the RSI. The first one is of an oversold reading in USD/JPY. Notice that the price increases soon after the oversold condition is signaled by RSI crossing below 30. Then we have an early or false oversold signal where the price keeps decreasing.
Soon thereafter, we get a third oversold signal in combination with a bullish divergence. Notice that the price reacts quickly and sharply after the bullish divergence. The fourth signal on the chart is an overbought signal, but we only see a consolidation in price action afterwards. The final signal we get is overbought again, and this RSI signal leads to a major trend reversal.
Stochastic Oscillator
This is another very popular indicator within the oscillator family. The Stochastic Oscillator is a 2-line indicator that fluctuates between the 0-100 value. The overbought zone is located between 100 and 80, and the oversold zone stays between 0 and 20.
When the two stochastic lines enter the 0-20 zone, traders interpret this as an oversold (buy) signal. When the two lines enter the 80-100 area, this is an overbought (sell) signal.
The calculation of the Stochastic oscillator consists of two formulas:
%K = (current close – lowest low) / (highest high – lowest low) x 100
%D = 3-period SMA of %K
The default structure of the Stochastic Oscillator takes into consideration 14 periods on the chart. The “Lowest Low” refers to the lowest point during the last 14 periods. The same is in force for the “Highest High” – it refers to the highest point during the last 14 periods on the chart. The multiplication by 100 serves to move the decimal point two digits.
You can trade divergences with the Stochastic Oscillator in the same way as you would with the RSI momentum indicator. A bullish divergence occurs when the Stochastic creates higher bottoms, and the price action has lower bottoms. The bearish divergence occurs when the Stochastic is creating lower tops while the price action is still creating higher tops.
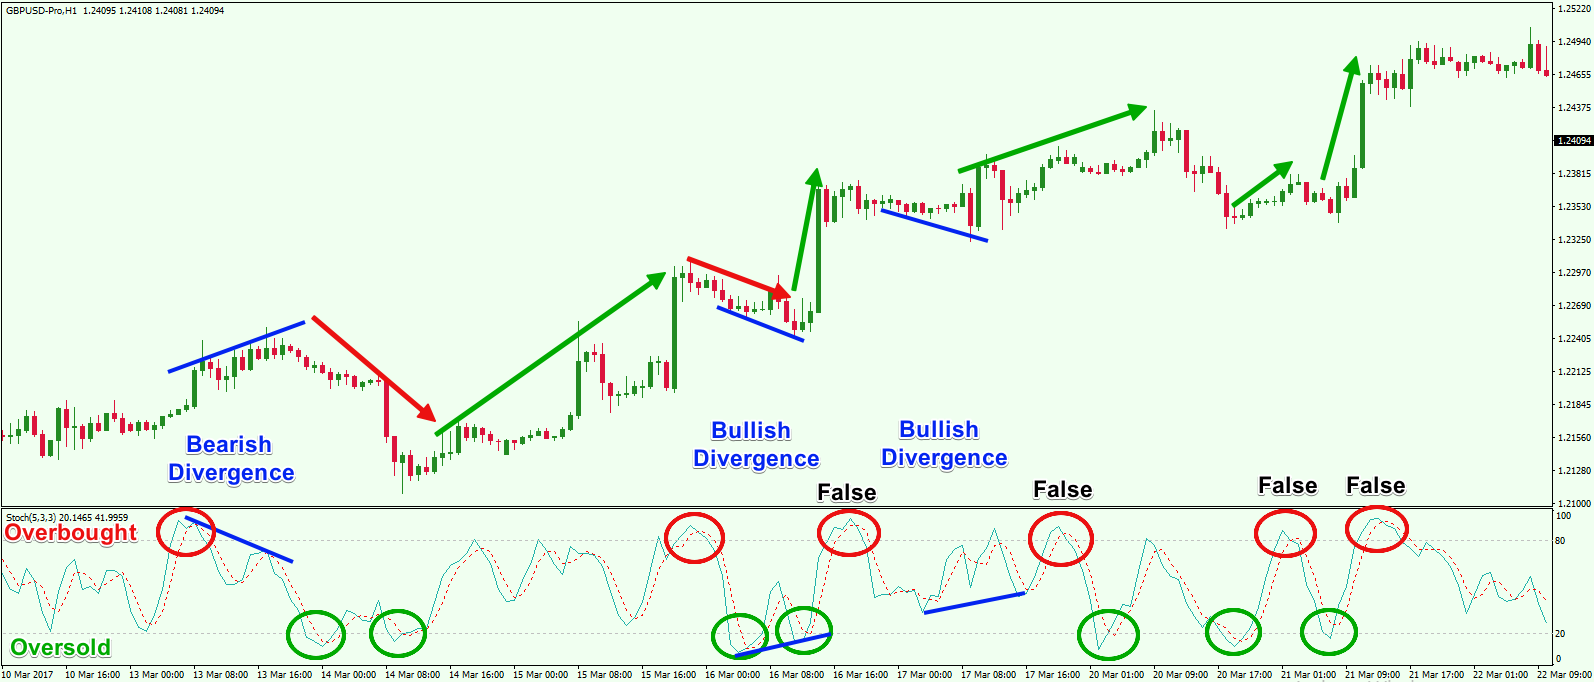
Above you see the H1 chart of the GBP/USD with the Stochastic Oscillator attached to the bottom. The red circles on the indicator show overbought signals that are likely to lead to price decreases. The green circles indicate oversold signals of the Stochastic that are likely to result in price increases. The blue lines indicate a divergence between the Stochastic and the price action.
Notice that the Stochastic creates four false overbought signals where the price does not move as expected. In the other cases, the price generally moves as predicted by the Stochastic.
Also take note of the three divergence patterns on the chart. We have one bearish divergence where the tops on the chart are increasing while the Stochastic tops are decreasing. The price decreases afterward.
There are a couple of bullish divergences as well. The price action bottoms decrease while the Stochastic bottoms are increasing. In these cases, the prices moved in the bullish direction as a result.
Momentum Oscillator
The last oscillator we will discuss is the Momentum Oscillator. This is another indicator that is typically attached to the bottom of the chart and consists of a single line plotted with values usually moving between 99 to 100.
The calculation of the Momentum oscillator involves the comparison of the current price versus the price a certain number of periods ago. The default setting of the Momentum indicator takes into consideration fourteen periods on the chart. Below is the Momentum indicator formula:
Momentum = (close price of the current period / close price 14 periods ago) x 100
The Momentum signal comes from accessing the direction of the momentum line. The general rule when using the Momentum Indicator is that when the line is ticking upward, this will provide a long bias. When the line is ticking downward, this will provide a short bias.
Aside from this, the Momentum indicator is a great tool for divergence trading, and this is where its primary effectiveness comes from. When the bottoms of the Momentum oscillator are increasing, and the bottoms on the chart are decreasing, we have bullish divergence that signals an upcoming price increase. When the tops of the Momentum indicator are decreasing, and the price action tops are increasing, we have bearish divergence that signals a likely price decline.
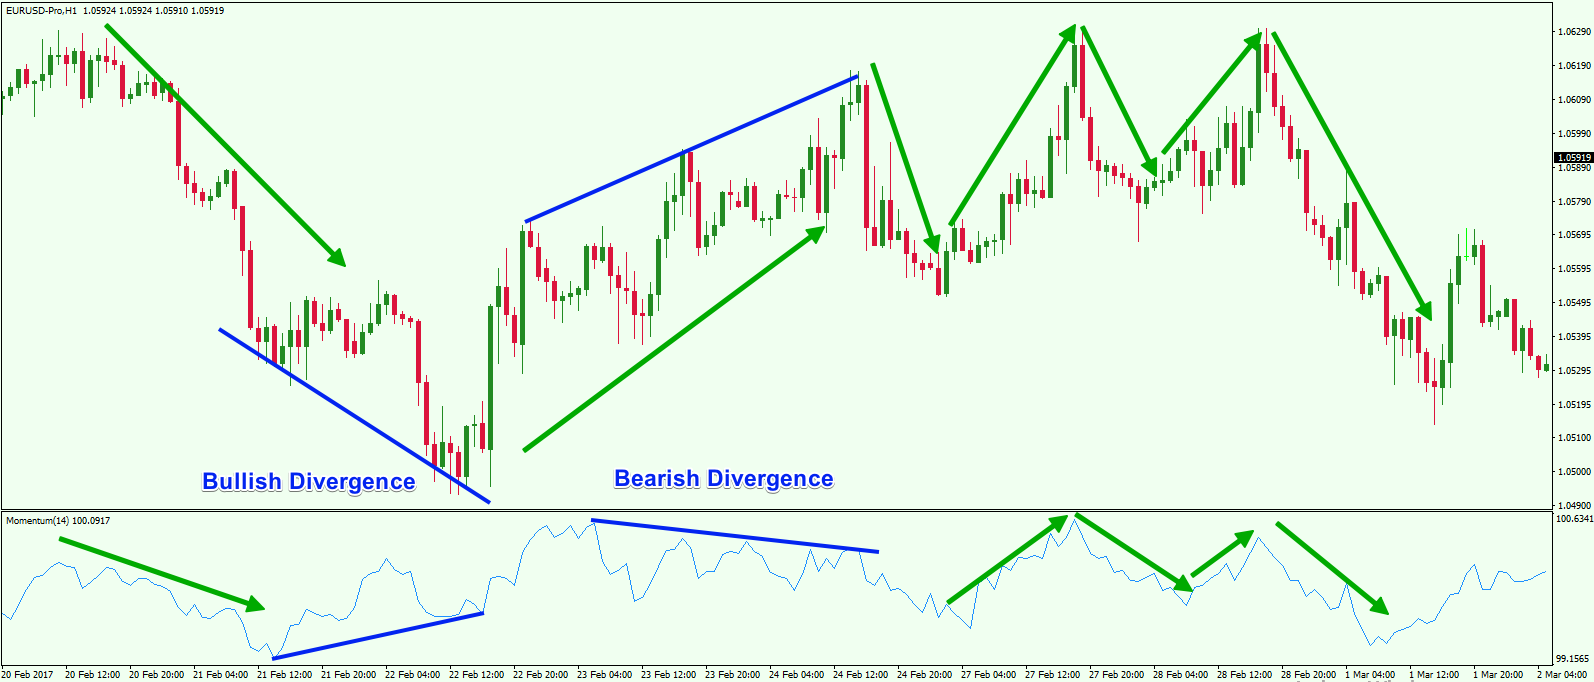
Above you see the hourly chart of the EUR/USD with the Momentum oscillator attached at the bottom. Notice how the price action is in harmony with the swings of the Momentum study. We also have a couple of divergences.
First, we get a bullish divergence where the bottoms of the Momentum oscillator are increasing, and the bottoms of the price action are decreasing. The price creates a bullish run afterward. But that bullish run leads to a bearish divergence on the chart. The tops of Momentum are decreasing while the tops of the price action are still increasing. The price of the EUR/USD turns down sharply soon thereafter.
Combining Technical Oscillators
Regardless of which technical oscillator your use, an oscillator strategy used in isolation would not be very effective due to the many false signals you can get. Therefore, it is always good to combine an oscillator with some other type of non-correlated analysis to provide more evidence for the trade such as Support and Resistance, Harmonic patterns, Elliott wave analysis, or other type of study.
Some traders like to combine two oscillators to confirm their signals. Keep in mind that the indicators mentioned are different but highly correlated so they will not provide for non-correlated confluence, but can add an extra layer of confirmation for your preferred oscillator.
In the upcoming example, I will use the Relative Strength Index in combination with the Stochastic Oscillator. I will enter the market only when there are matching signals coming from both indicators. Then I will hold my trade until I get an exit signal from the RSI. An exit signal could be an overbought/oversold signal, divergence, or increasing/decreasing tops or bottoms.
Let’s see how it works:
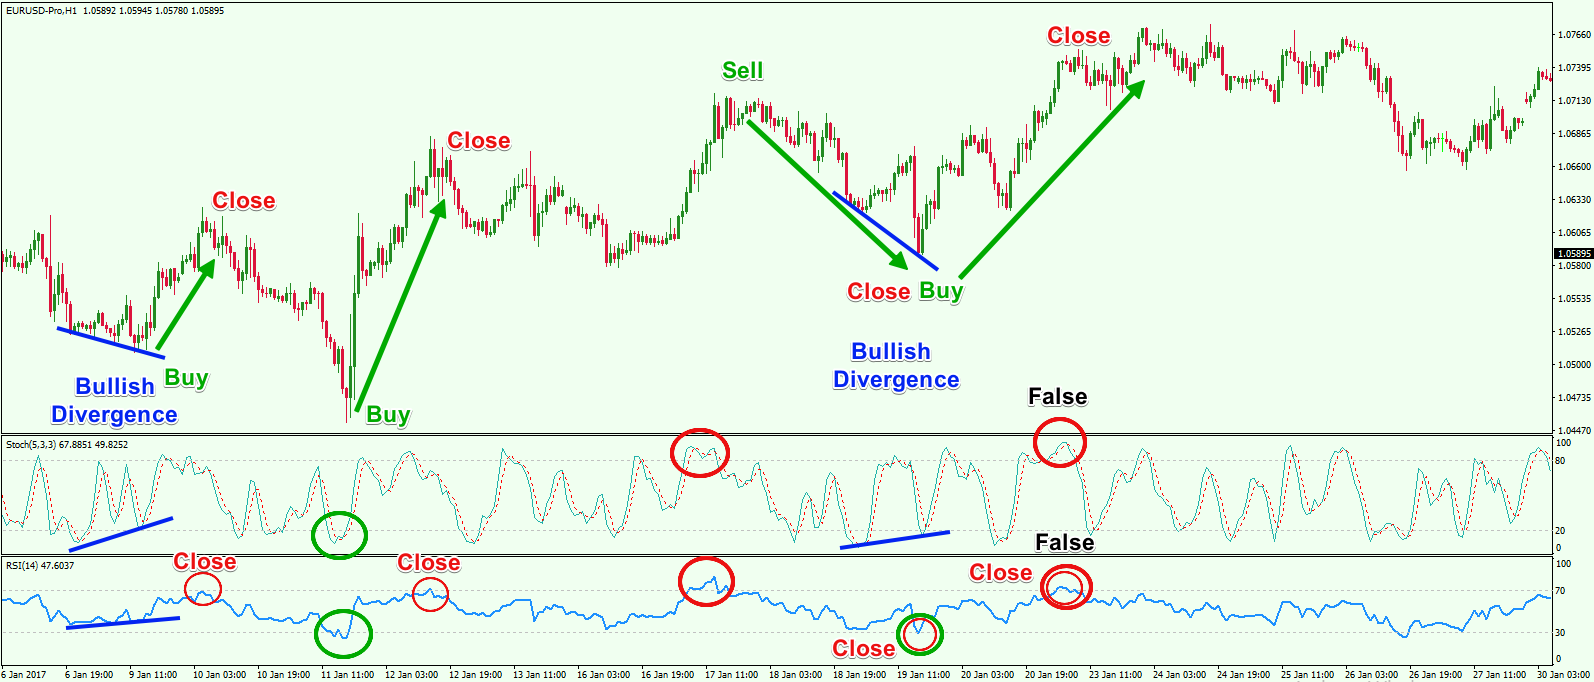
Above you see the H1 chart of the EUR/USD for January 2017. The image suggests four trades where we have matching signals from the Stochastic Oscillator and the Relative Strength Index.
The first signal comes when the price on the chart creates lower lows and the Stochastic and the RSI close higher lows. This is an obvious bullish divergence on the chart that could be traded long. You can hold that trade until the RSI touches the line of the overbought area. However, this slight touch of the overbought area is not sufficient to confirm a short signal. But it is enough evidence to close out the trade.
The next signal appears when both of the RSI and the Stochastic give oversold signals (two green circles). You can buy the EUR/USD holding the trade until the price touches the overbought area again. Again the RSI only touches the overbought area without entering the zone. This is why you would simply close the trade but would not initiate a new short.
The third trade comes when the RSI and the Stochastic enter the overbought area. This is a strong sell signal, which provides a solid short trade opportunity. You should hold the trade until the RSI enters the oversold zone.
Soon price action creates an oversold RSI signal that is supported by a bullish divergence between the Stochastic and the price action. This is another good long signal on the chart that could be used to open a long trade. When this happens, the Stochastic is in the overbought zone as well.
This appears to be a false signal that could very easily lure us into a losing trade. But notice that when you get the signal, the price does not initiate a downward move, but instead just begins to range. This should be used as a hint that the signal you are looking at may not materialize.
Conclusion
- Oscillators are popular technical tools used by many forex traders.
- Oscillators are considered Leading Indicators because their signals can occur before the expected event has actually happened on the chart.
- When applied correctly, Forex oscillators are very good indicators for timing market reversals.
- The basic oscillator strategy suggests three signal types:
- Overbought – Indicates that there is too much bullish market sentiment and the pair is likely due for a bearish pullback or reversal. You would approach this with a short trade.
- Oversold– Indicates that there is too much bearish market sentiment and the pair is likely due for a bullish pullback or reversal. You would approach this with a long trade.
- Divergence between Price and Oscillator:
- Bullish divergence occurs when the oscillator is creating higher bottoms, and the price action has lower bottoms. This creates a possible long trade setup.
- Bearish divergence appears when the oscillator creates lower highs, and the price action has higher highs. This creates a possible short trade setup.
- Some of the most widely used oscillators in Forex trading are:
- Relative Strength Index
- Stochastic Oscillator
- Momentum Oscillator
- The big disadvantage of oscillators is that they can give many false signals. Therefore, you should always combine your preferred oscillator with an additional type of trading analysis.
- Traders wanting to have confirmation from two oscillators can combine Relative Strength Index and the Stochastic Oscillator. You could match signals from both indicators before opening trades. Just keep in mind that both are highly correlated and as such will usually provide redundant information about the price action.