The parabolic SAR is one of the lesser-known trading indicators out there. Some traders may have heard of this technical study, however, many traders appear to be somewhat confused around its proper application. Although it is a bit more complicated in its makeup than some other more familiar trading indicators, it’s certainly worth studying, because there are some great uses for it as we will soon see.
What Is The Parabolic SAR Indicator?
The Parabolic SAR indicator, PSAR, which is also called the stop and reverse indicator, was developed by J. Welles Wilder Jr in the 1970s. He’s also attributed with the creation of the popular Relative Strength Index, RSI, indicator, as well as the Directional Movement Index, DMI.
PSAR was originally devised as a stop and reverse trading system, that was always in the market. As the name implies it was commonly referred to as the Parabolic SAR trading system. However, it has been shown that there are better ways to apply the SAR study, which we will be covering in this lesson.
Essentially, the PSAR indicator helps in the identification of optimal entry and exit points. It’s a very versatile indicator that can be used in a myriad of ways, however, it’s in its application as a trade execution signal, wherein it shines the most.
Visually, this indicator is plotted alongside the price data and consists of a series of dots either above or below the price. Let’s take a closer look at what the Parabolic SAR indicator appears like on a price chart.
Here’s an example of the Parabolic SAR indicator plotted within the context of an up trending market.
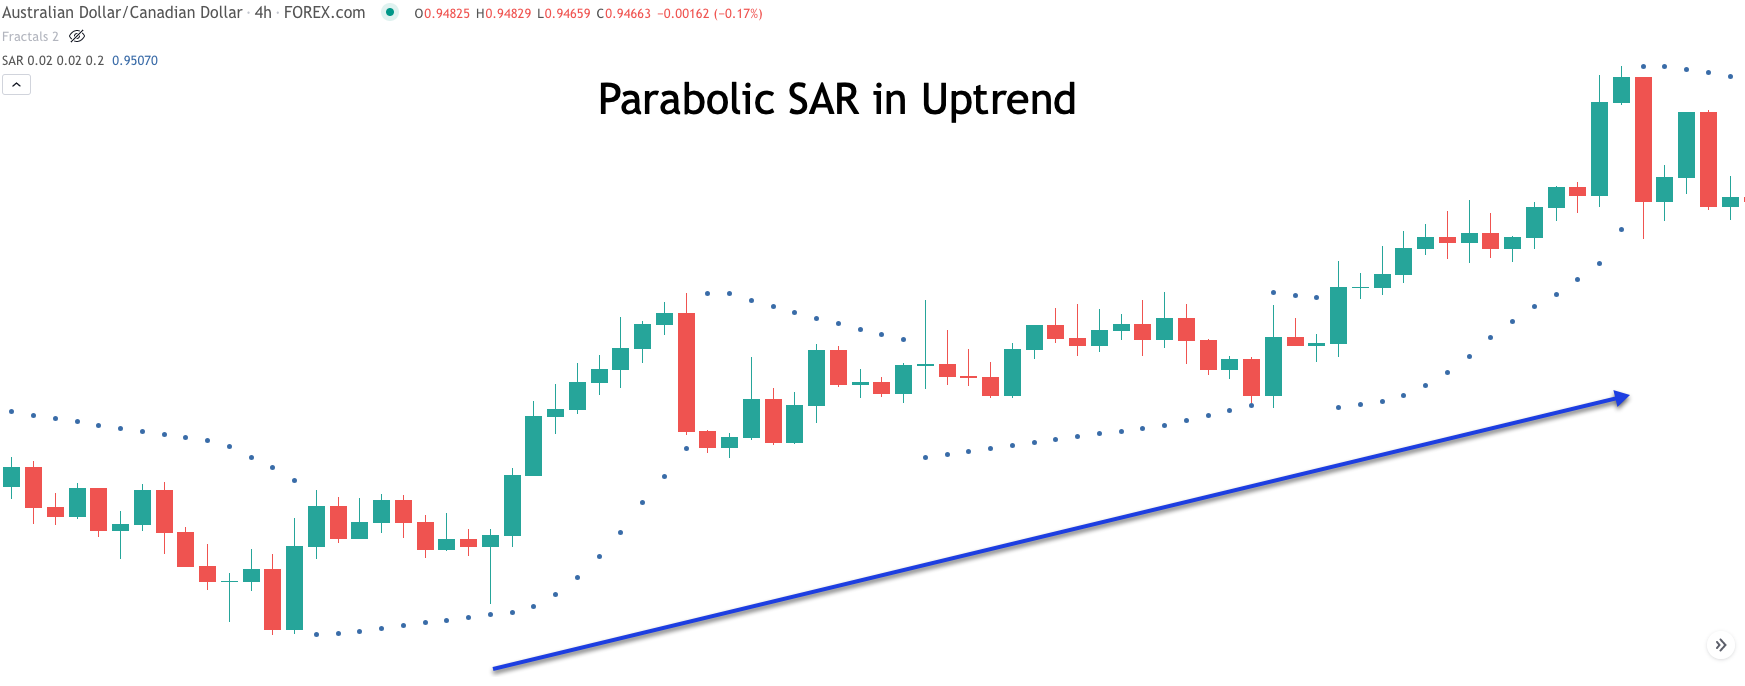
Notice how we can see a series of dots below the price as the price is trending higher. We can also see how these dots begin to tighten with the price as the trend progresses over time. This is an important characteristic of the SAR indicator. Typically, when the dots begin to shift from displaying below the price action to above the price action, then that is considered a signal that favors the short side of the market.
Let’s now take a look at an example of the Parabolic SAR plotted in a down trending market.
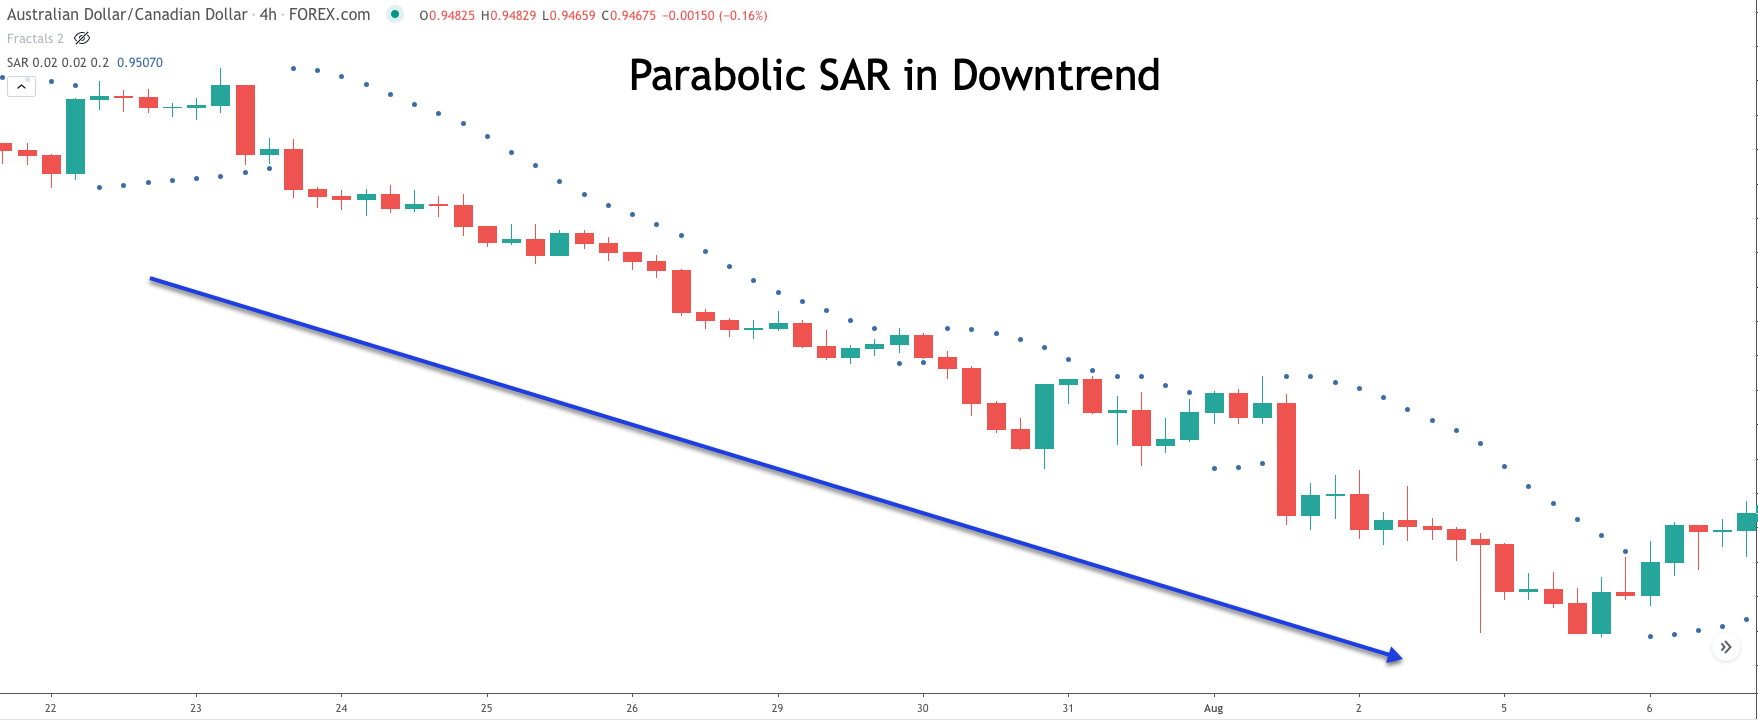
Notice here, how we can see the series of dots above the price action as the price is trending lower. Additionally you will also notice that the dots begin to tighten with the price as the trend moves further and further along. In this case, when the dots begin to move from showing above the price action to below the price action, then that should be viewed as an event that favors a bullish move going forward.
Because of the accelerating nature of the Parabolic SAR, is often used as an exit trigger during a trending market phase. This is one of the best ways to incorporate the Parabolic SAR indicator into your trading program. By doing so, you will be able to capture a good percentage of the trending phase, without having to give back a sizable portion of your open trade profits.
Parabolic Sar Formula
The parabolic SAR indicator takes into account various parameters within its calculation. Before we take a look at the exact formula for the parabolic SAR, let’s first present the parameters.
Prior PSAR: The PSAR value in the previous period.
Extreme Point (EP): The highest price achieved within the current uptrend or the lowest price point in the current downtrend.
Acceleration Factor (AF): The default for acceleration factor is set at 0.02 and increases by 0.02 every time the extreme point is reached.
Max Acceleration Factor: this is the maximum limit on the AF irrespective of the duration or amplitude of the trend.
With these parameters in mind, the parabolic SAR formula is shown below:
Within an uptrend: Current PSAR = Previous PSAR + Previous AF x (Previous EP – Previous PSAR)
Within a downtrend: Current PSAR = Previous PSAR – Previous AF x (Previous PSAR – Previous EP)
Most if not all trading platforms these days will include the parabolic SAR indicator. And although each of these platforms will automatically calculate and plot the current and past PSAR values, it is nevertheless, important to understand the actual formula and how it’s calculated. By doing so you will have a better understanding of the mechanics of the indicator, which will help you to implement it more effectively.
The most significant input within the parabolic SAR formula is the acceleration factor. Most platforms will set this to a default value of 0.02. Although you can adjust this variable based on your preferences, is highly recommended that you stick with this default parameter in most cases.
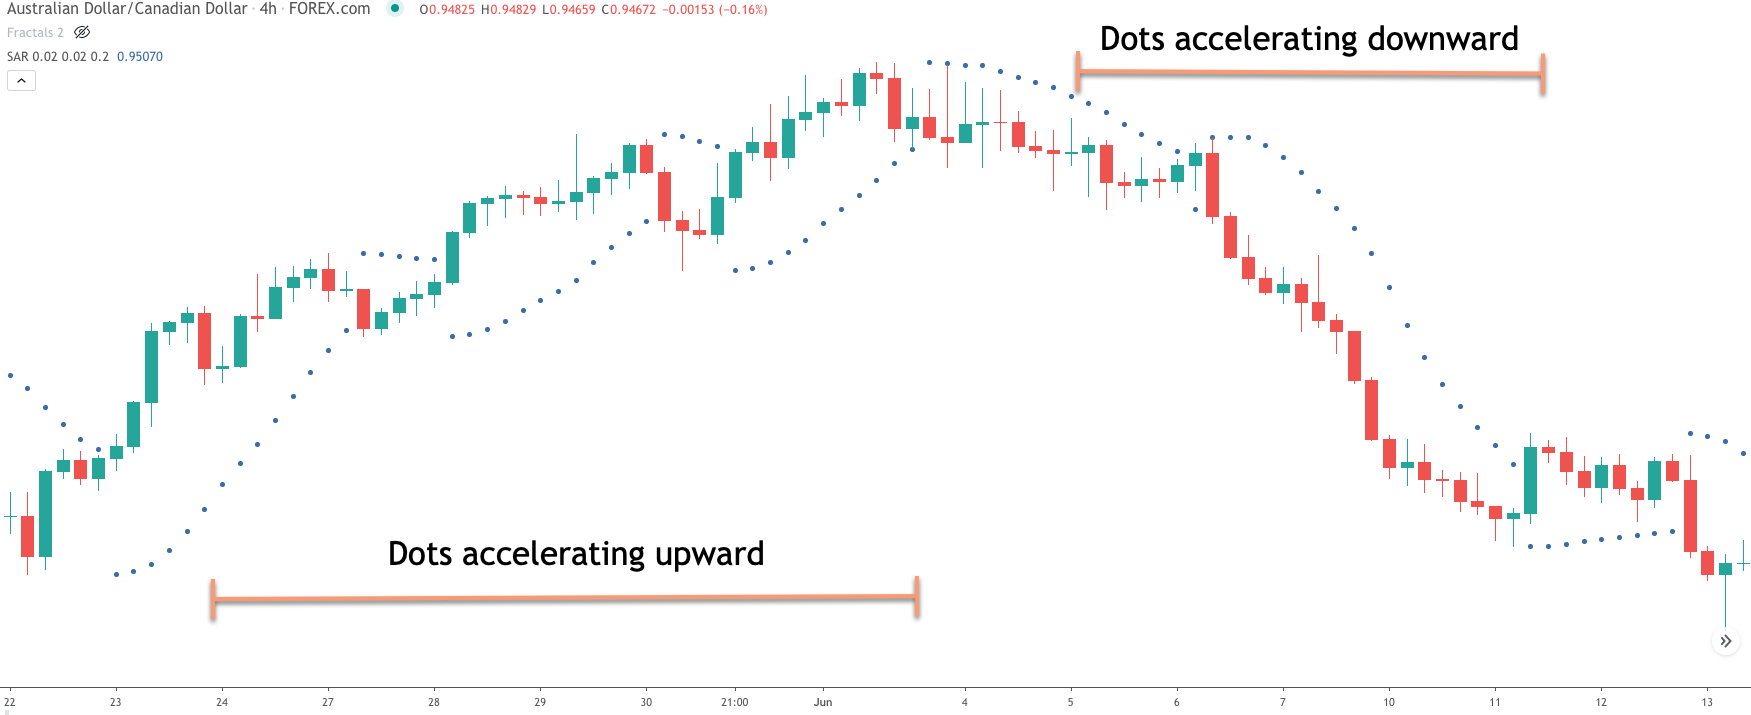
Below you will see an example of the parabolic SAR indicator plotted with the default 0.02 acceleration factor. Notice how the dots below the rising price moves accelerate and move closer and closer to the price action. Similarly you can see how the dots above the declining price moves accelerate and draw nearer to the price action as well.
Advantages and Disadvantages of the Parabolic
Now that we have a good understanding of what the parabolic SAR indicator is, and how it’s calculated, let’s now discuss some of the benefits and drawbacks of using the indicator. One of the primary advantages of using this indicator is that it provides for an early signal to exit a position within a trending market condition. Additionally, it can provide for an early entry execution signal into a new trade as well.
Due to the accelerating nature of the parabolic indicator, it will ensure that we are able to capture a sizable portion of a price move, without worrying about giving too much back to the market. As such, the best use of the parabolic SAR indicator is as a trailing stop loss tool.
For example, once we are in a trade which is trending higher, we could use the dots which would print below the price action as a confirmation for continuing to stay long. But just as soon as the dots began to flip sides, we could use that as our signal to exit the position. And the same reasoning could be used for trailing the stop loss using the parabolic SAR indicator in a down trending market.
One of the primary drawbacks of using the parabolic indicator is that it will sometimes take us out of a winning trade prematurely. In other words, due to the increased sensitivity of the indicator as the trend progresses, this will have the effect of drawing the dots closer and closer to the price action. As such, even a minor retracement against a strong trend can sometimes signal an exit when using the parabolic SAR.
This is something that trend following traders need to be aware of, and either accept as shortcomings, or adjust the acceleration parameter to reduce the level of sensitivity. And so, under the default setting of 0.02, which is the really the best Parabolic Sar setting, you can sometimes miss out on a large trend move, especially if that specific price movement has a tendency of making deeper corrections along the way.
As with every other type of trading indicator, there are pros and cons to using this one. But all in all, the parabolic SAR is definitely worth testing out with your own strategies, because it’s benefits far outweigh its drawbacks.
Parabolic Sar Trading Strategy
We will now devise a trading strategy that incorporates the parabolic SAR indicator. This particular trading strategy will utilize three different technical studies. The first of these indicators will be the Directional Movement Index, the second will be the 200 period moving average, and the third component will be the parabolic SAR indicator.
The strategy will seek to find emerging bullish price moves, within a larger bullish trend, and seek to find emerging bearish price moves, within a larger bearish trend. Let’s take a look at our parabolic SAR strategy in more detail.
Firstly, we will define the larger trend of the market using the 200 period simple moving average. When price is above the 200 period simple moving average, we will focus on trades only to the long side. And similarly, when the price is below the 200 period simple moving average, then we will concentrate on initiating trades only to the short side. Essentially, the 200 SMA will act as our longer-term trend filter. Along with this, we will use the Parabolic SAR indicator to gauge the shorter term trend. We will want the dots for the PSAR to be above the current price for short signals, and below the current price for long signals.
Once we have identified the larger market trend, we will look to trade smaller swings in the direction of that trend. Often, what we will find in the price action is that the markets will move from periods of low volatility to periods of high volatility. This tendency can often be seen on the Directional Movement Index.
The Directional Movement Index is made up of three lines. The first, is the ADX line, which measures the trendiness or non-trendiness of a specific market. The higher the ADX line, the more a market is said to be trending, and along the same lines, the lower the ADX line the less a market is said to be trending. The second and third lines within the directional movement index are called the +DI line, and the -DI line. When the positive DI line is above the negative DI line, the market has bullish implications, and conversely when the negative DI line is above the positive DI line, the market has bearish implications.
Now that we have some background on the directional movement index, how will we be incorporating it into this Parabolic strategy? Well specifically, what we all want to see is the ADX line move from below a reading of 20 to a reading of above 20. If the trend, as defined by the 200 period Moving average is up, then we will look for the positive DI line to be above the minus DI line. If instead, the trend is down, as defined by the 200 period Moving average, then we will need the negative DI line to be above the positive DI line.
Once these conditions are met, then we will execute a new entry order at the market. The initial stop will be set at the most recent swing high in the case of a sell signal, and will be set at the most recent swing low in the case of a buy signal. As for managing the position, if the prices move in our favor, we will utilize the parabolic SAR indicator with the default .02 acceleration setting.
As such, our parabolic SAR indicator will act as our trailing stop loss mechanism. More specifically, for a long position, we will continue to hold until the dots that comprise the parabolic SAR shift from below the price to above the price.
And the same would go for a sell signal but obviously in reverse. That is to say that we will hold onto the short position until the dots change from plotting above the price to below the price.
PSAR Trading Strategy in Uptrend
Let’s now take a look at an actual example of our above-described parabolic trading strategy on a price chart. The chart below shows the price action for the US dollar to Japanese Yen forex pair based on the daily timeframe.
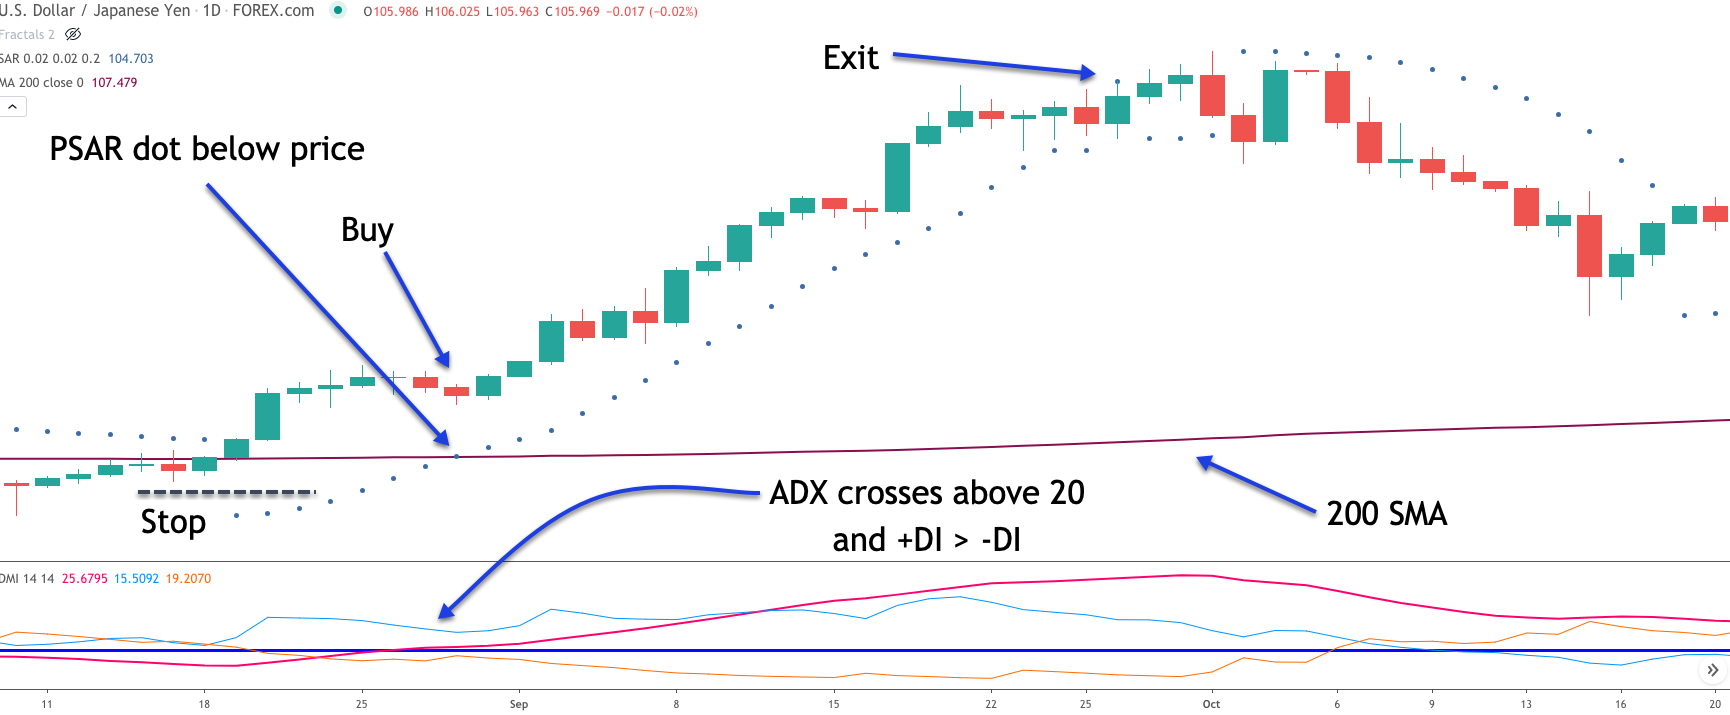
The dotted lines below and above the price is the parabolic SAR indicator. The maroon line at the lower end of the price chart represents the 200 SMA line. On the lower pane, you will find the Directional Movement Index, or DMI indicator. Notice the DMI indicator is comprised of three lines. The red line is the ADX line, the light blue line is the +DI line, and the orange line is the -DI line. The horizontal line plotted in blue represents the 20 threshold level that we will be watching for in the ADX line.
If we start towards the left end of the price chart, we can see that the price was approaching the 200 period SMA line from below. Soon afterwards, both the PSAR indicator and the 200 SMA are pointing to a bullish bias within this currency pair. Notice how the price crosses above the 200 SMA line, and the PSAR indicator shifts from plotting above the price to plotting below the price.
Now that these two conditions have been met, we would look to the DMI indicator to initiate are buy entry. Remember, we want the ADX line to cross above the 20 threshold from below. At the same time, the +DI line should be above the -DI line, indicating that the market is beginning to trend, and that trend direction should be to the upside. Remember, the ADX line provides us information on the trendiness of the market, while the plus or minus DI line provides us information on the direction of the next price leg.
You can see where the ADX line eventually crosses above the 20 threshold. This would provide us our buy entry signal. We would initiate our long position immediately following this event, at the start of the next price bar. The initial stop loss would be placed at a recent swing low preceding the buy signal. You can see the buy signal and the stoploss placement noted on the chart. As soon as our entry signal was triggered, the price began to rise quickly and we would have seen our open trade profits increase as well.
At this point, we would need to monitor the parabolic SAR indicator closely, as it will act as our trailing stop loss order. The actual signal to close out this position would occur when the dots representing the parabolic SAR shift from printing below the price to printing above the price. If you refer to the price chart again, you can see the exit point marked. Notice the single dot that printed above the price, which triggered the exit signal.
PSAR Strategy in Downtrend
Let’s now examine the PSAR indicator strategy within the context of a down trending market. Below you will find the price chart for the Australian Dollar to Canadian Dollar currency pair. The price action is shown on the 240 minute timeframe.
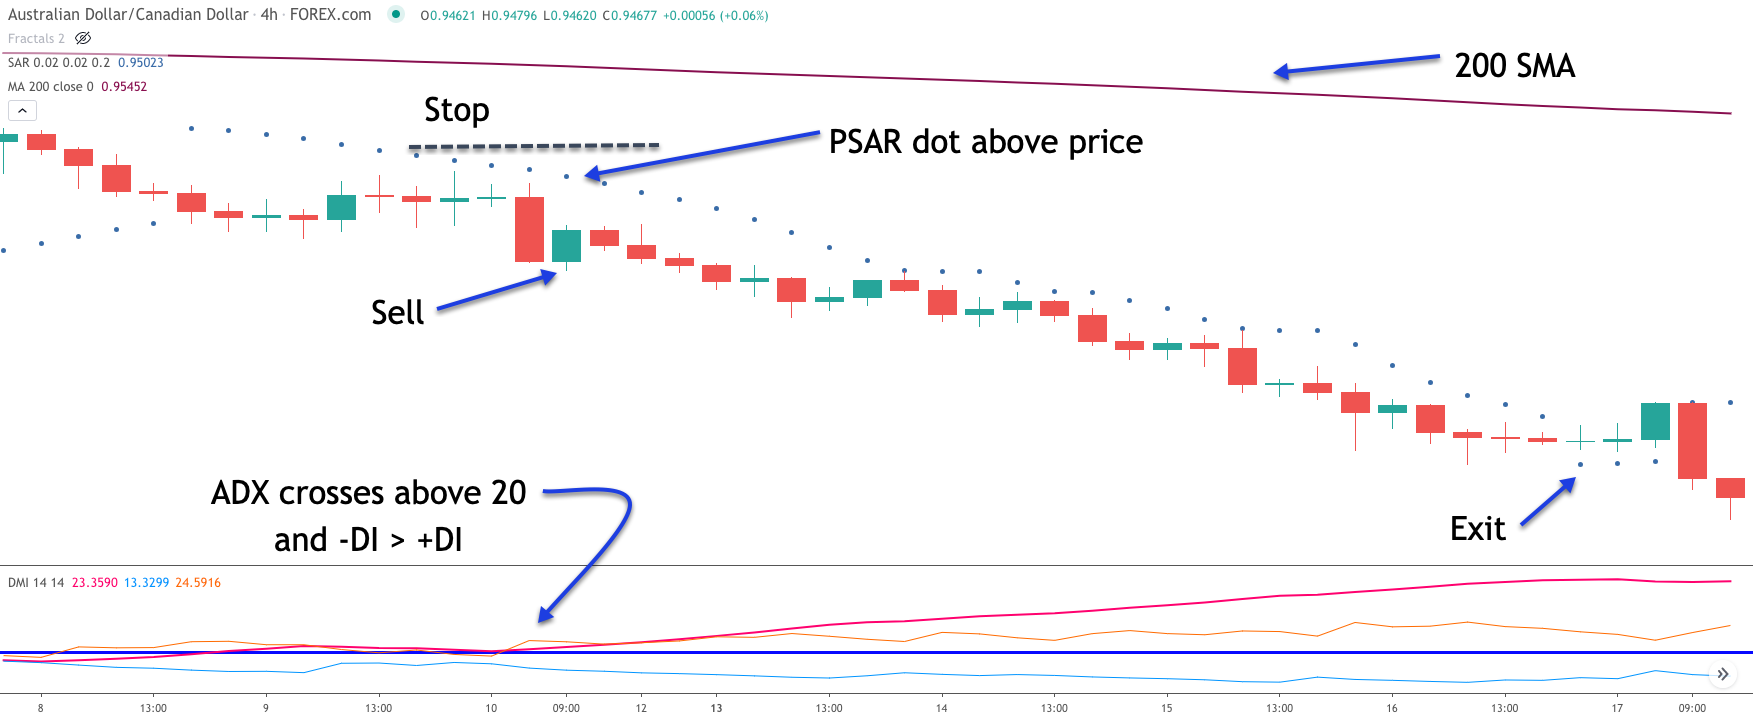
As with our earlier example, you can spot the parabolic SAR indicator on this forex chart by referencing the dots that are printed above and below the prices. The maroon line above the price action represents the 200 period simple moving average line, which again serves as our longer-term trend filter.
Remember the idea is to trade the smaller swings in the direction of the larger trend. The smaller price moves within the trend are identified using the PSAR indicator. So when both the parabolic SAR and 200 SMA are in unison, then we have an opportunity for a potential trade. At the lower pane of the chart you will find the DMI indicator plotted.
Let’s now dissect this parabolic trade set up in more detail. Firstly, if we scan from the left side of this image, we can see that the 200 SMA is clearly pointing downward, and that the prices are trading below it as well. The parabolic SAR indicator however was showing a shorter-term upward bias. However, we can see that the PSAR signal did shift from bullish to bearish soon afterwards.
With these two conditions having been satisfied, we can start tracking the DMI indicator for a short trade signal. That actual signal would be triggered when the ADX line crosses above the 20 threshold from below, and at the same time, the minus DI line is shown to be above the positive DI line. If you look closely at the price chart, you can see when this scenario actually occurs.
Upon confirmation that the PSAR is still printing above the price at this critical juncture, we would prepare for entering a short position at the start of the following candle. The initial stop was would be placed above the most recent swing high preceding the sell entry signal. The sell signal, and the stop loss order have been referenced on the price chart.
Soon afterwards, the prices began to move lower in our favor. Notice how the dots remain above the price action, as the prices decline. We would want to stay in the trade until the point at which the first PSAR dot prints below a price candle. This event would trigger our exit out of the trade. You can see where that occurred on the price chart.
It’s important to remember that the parabolic SAR indicator will typically track price moves within a trend leg fairly closely, and will accelerate closer and closer to price as the trend matures. This characteristic is what provides for its advantageous use as a trailing stop mechanism. It will help to protect open profits better than most other trading indicators or technical studies. The primary downside, however, is that due to its high level of sensitivity, anything beyond minor retracements, can often trigger a premature exit.
Summary
Most traders are familiar with the different types of momentum indicators such as MACD, Stochastics, and RSI. And they are also familiar with different types of moving averages, and volume-based studies as well, but the parabolic SAR indicator is a unique type of technical study that is in a class of its own.
Although this indicator was originally intended to trade continuously in the market as a stop and reverse system, we have found that the best use of PSAR is as a trailing stop mechanism. When this indicator is used within this context, it provides a great deal of value in terms of maximizing profits on a winning position.