If you are familiar with using Japanese candlestick trading methods, then it is likely that you already have a good working knowledge of the versatility of using candlestick patterns in both trending and range bound markets. When it comes to trading candlestick patterns, the three bar patterns are some of the most reliable and useful bar patterns in the market.
How to Identify a Triple Candlestick Pattern
To identify triple candlestick patterns in forex, you need to look for specific formations that consist of three candlesticks in total.
These formations help traders determine how the price of a given asset is likely to behave in the course of the next few periods or longer.
Some three-period candle stick patterns would signal a continuation of bullishness or bearishness in the market, whereas other candlestick reversal patterns may signal the end of a prevailing trend and the start of a new trend in the opposite direction.
Nevertheless, there are some forex candlestick patterns in this group that can also signal a tentative nature of the market, where the price of the asset is most likely to trade within a tight range.
Regardless of the signal a three-period candlestick pattern generates, it will have some distinct features which will help you identify and interpret the pattern. These formations can assist you with making a sound trading decision based on what the pattern represents.
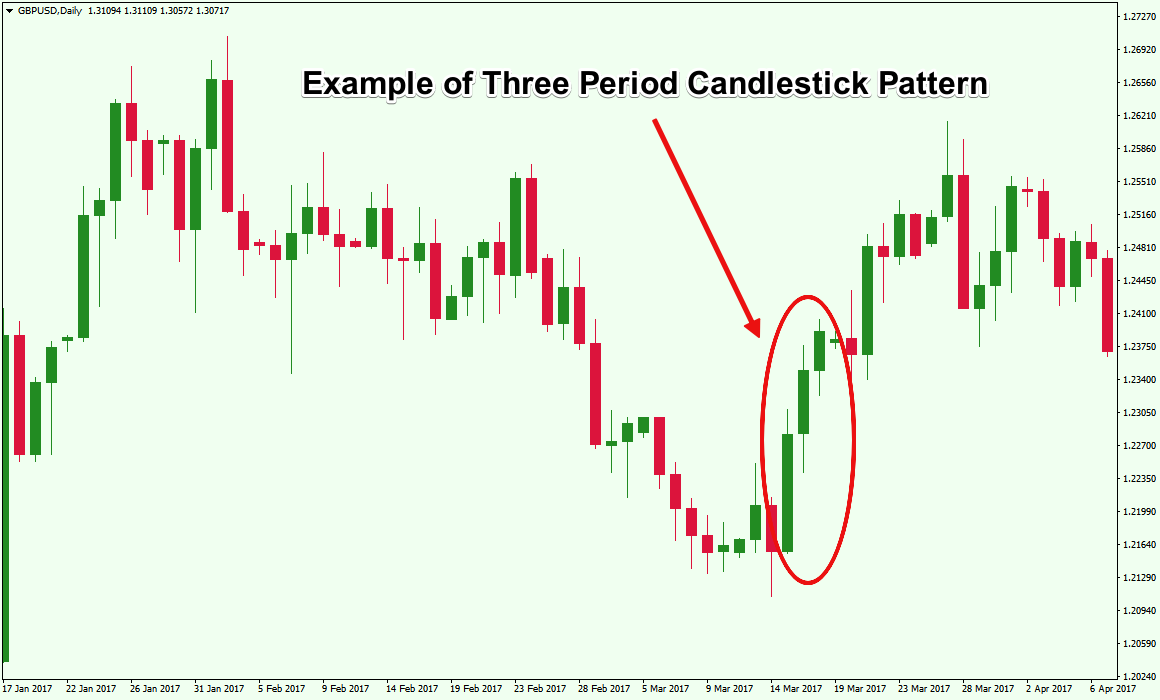
Figure 1: A Three Period Candlestick Pattern Can Help You Forecast Short Term Directional Movement
The first thing you need to remember while identifying a three-period candlestick pattern is that it will always form a combination of three separate candlesticks. There are several well recognized triple candlestick patterns that Forex traders can utilize to gain a high chance of producing a winning trade. You should memorize a handful of these patterns in order to quickly identify them as they appear on the chart.
Let’s take a look at some of the most reliable candlestick patterns in this category and see how you should interpret these to make consistent profits in your forex trading program.
Reliable Triple Candlestick Pattern #1: Morning Star and Evening Star
Both the Morning Star and Evening Star patterns comprise a combination of three candlesticks, but they signal opposite directional movement in a currency pair. When you see a Morning Star pattern, you should consider it to be a bullish signal. On the other hand, when you find an Evening Star pattern, you should look to place a sell order as it is generally considered to be a bearish signal.
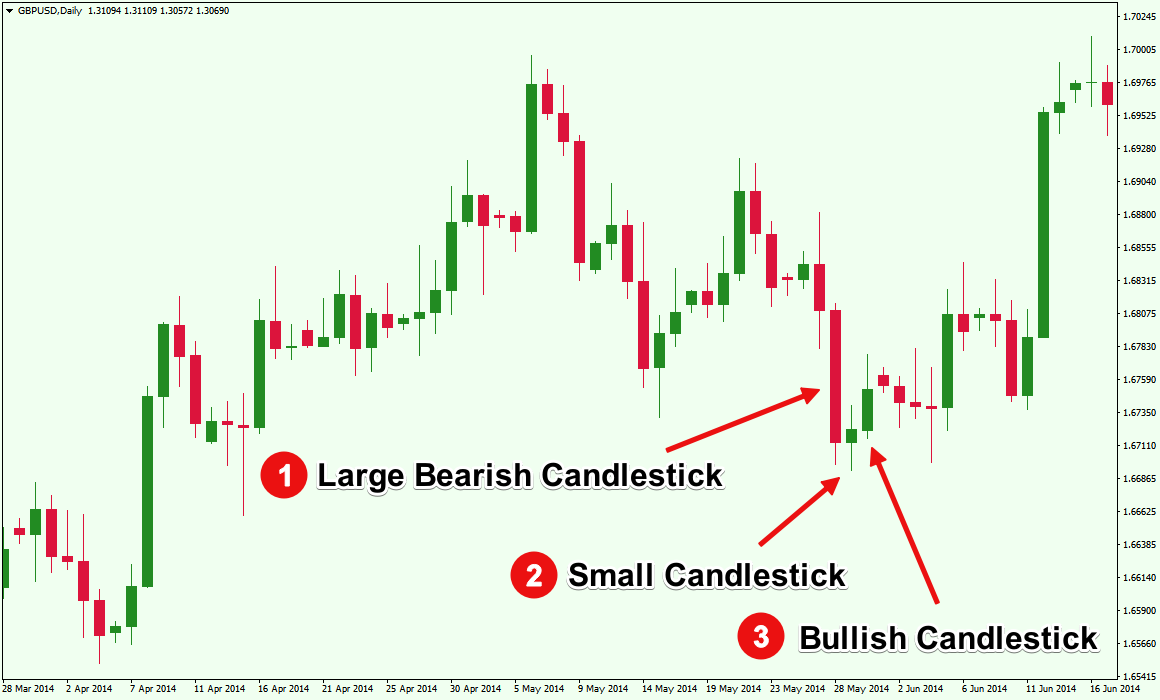
Figure 2: Formation of a Morning Star Pattern Triggered a Bullish Trend
A Morning Star pattern would start with a large bearish candlestick. The second candlestick would be a smaller one, and it could be either a small bullish candlestick or a small bearish candlestick. In fact, it can even be a Doji that indicates tentativeness in the market. However, to make the triple candlestick pattern a Morning Star, the third candlestick needs to be a bullish candlestick that closes near or above the halfway of the first bearish candlestick. As you can see in figure 2, the three-period pattern we identified meets the requirement to be called a Morning Star. Consequently, as soon as the price of GBPUSD broke above the high of the first bearish candlestick, it triggered a bullish trend.
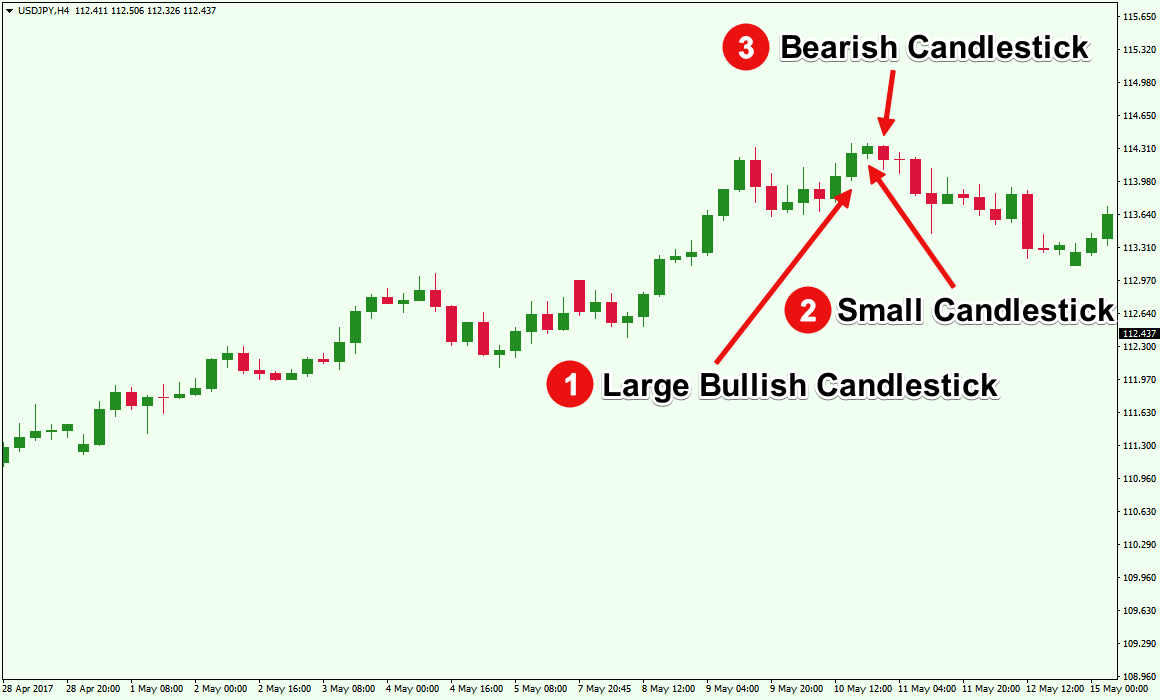
Figure 3: Formation of an Evening Star Candlestick Triggered a Bearish Trend
As demonstrated in figure 3, an Evening Star pattern would start with a large bullish candlestick. Similar to the Morning Star, the second candlestick in an Evening Star would also be a smaller one. However, once again, to make the triple candlestick pattern an Evening Star, the third candlestick needs to be a bearish candlestick that closes at least halfway into the first bullish candlestick. As you can see in figure 3, as soon as the price of USDJPY broke below the low of the first bullish candlestick, it triggered a bearish trend.
As a trend reversal signal, these two triple bar candlestick patterns generate the most reliable signals when they form after a prolonged trend. Therefore, look for a Morning Star pattern at the bottom of a downtrend, then consider placing a buy order. Similarly, if you find an Evening Star at the top of an uptrend, you should look for an opportunity to place a sell order.
Reliable Triple Candlestick Pattern #2: Three White Soldiers and Three Black Crows
Three White Soldiers and Three Black Crows are also two very reliable triple candlestick patterns.
However, unlike the Morning Star and Evening Star patterns, the Three White Soldier and the Three Black Crow patterns typically act as trend continuation patterns when they form in the middle of an established trend.
In order to create a Three White Soldiers pattern, three consecutive long bullish candlesticks need to be formed, where the second and third candlesticks should be larger or at least equal to the previous ones.
Keep in mind that the Three White Soldiers pattern acts as a bullish signal. By contrast, when you see three long and consecutive bearish candlesticks, where the second and third candlesticks are larger or equal than the previous one, you can be pretty sure that it is a Three Black Crows pattern and the price is likely to turn bearish.
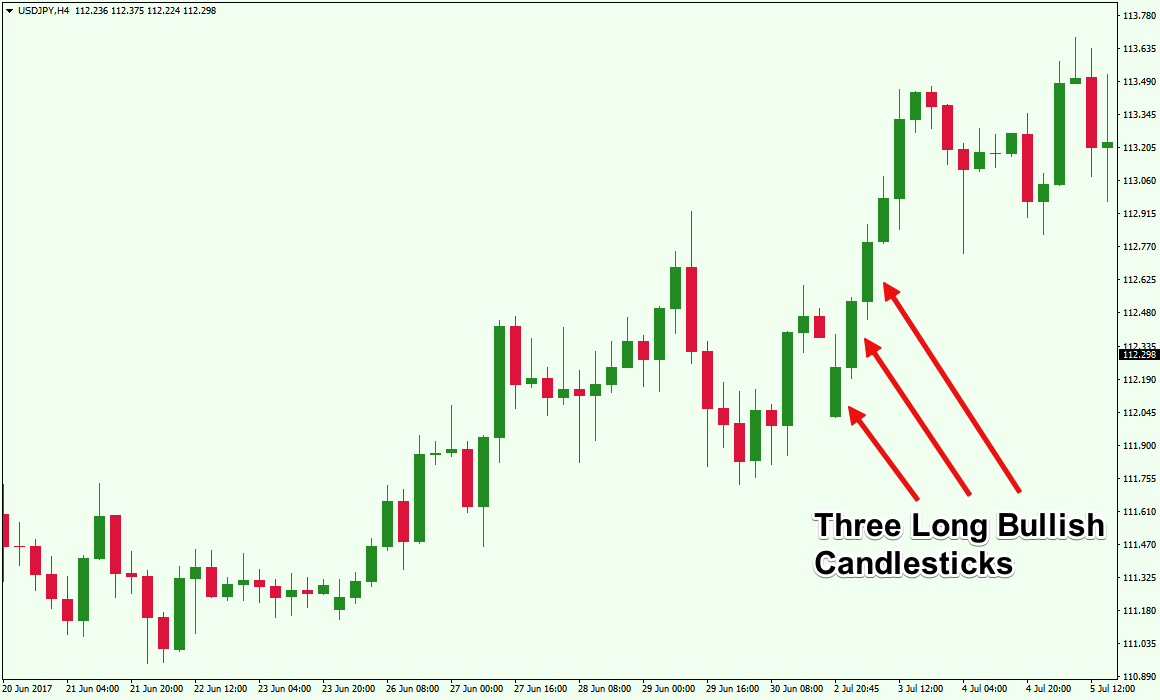
Figure 4: Three Consecutive Long Bullish Candlesticks Formed a Three White Soldiers Pattern
If you take a closer look at figure 4, you can see that it is very similar to the figure 1. However, the only difference is that in figure 1, the first long bullish candlestick is the largest in the series, which makes it an invalid Three White Soldiers pattern. However, in figure 4, we have identified the three-successive tall bullish candlesticks where the second candlestick body is larger than the first one, and the third candlestick is equal to the second one, if not larger. As a result, this pattern fits the definition of a Three White Soldiers pattern that signaled additional bullish momentum in the market.
As you can see, once the GBPUSD price penetrated above the high of the third bullish candlestick, it triggered the trend continuation.
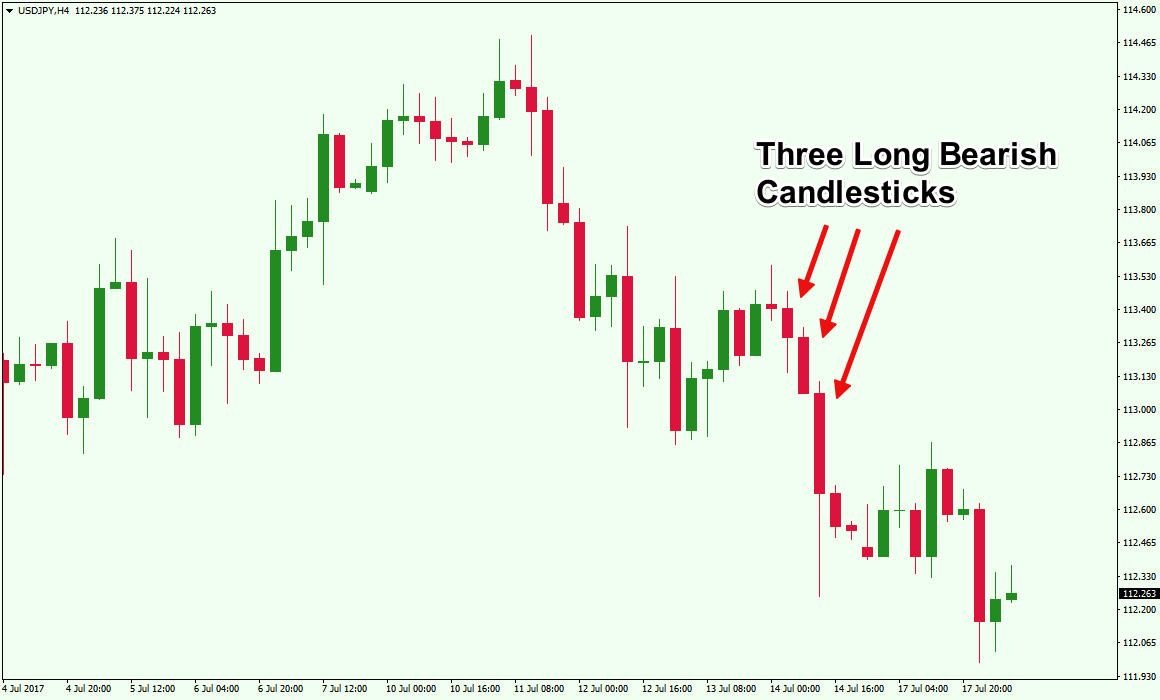
Figure 5: Three Consecutive Long Bearish Candlesticks Formed a Three Black Crows Pattern
You can guess by now that the Three Black Crows pattern is the exact opposite of the Three White Soldiers pattern. As you can see in figure 5, the first bearish candle was followed by another bearish bar that had a larger body than the previous one. Finally, a third bearish candlestick appeared that formed the Three Black Crows pattern.
Most novice Forex traders make a common mistake when they spot three successive bullish or bearish candlesticks and think they have spotted a Three White Soldiers or Three Black Crows pattern.
However, as we discussed earlier, you need to be sure that each successive candlestick body is larger than or at least equal to the previous candlestick in order to identify the triple candlestick pattern as a valid Three White Soldiers or Three Black Crows pattern.
Reliable Triple Candlestick Pattern #3: Three Inside Up and Three Inside Down
Just like the Morning Star and Evening Star patterns, Three Inside Up and Three Inside Down are also considered to be reversal patterns. Three Inside Up and Three Inside Down patterns tend to work best when they appear at the bottom of a downtrend and the top of an uptrend, respectively.
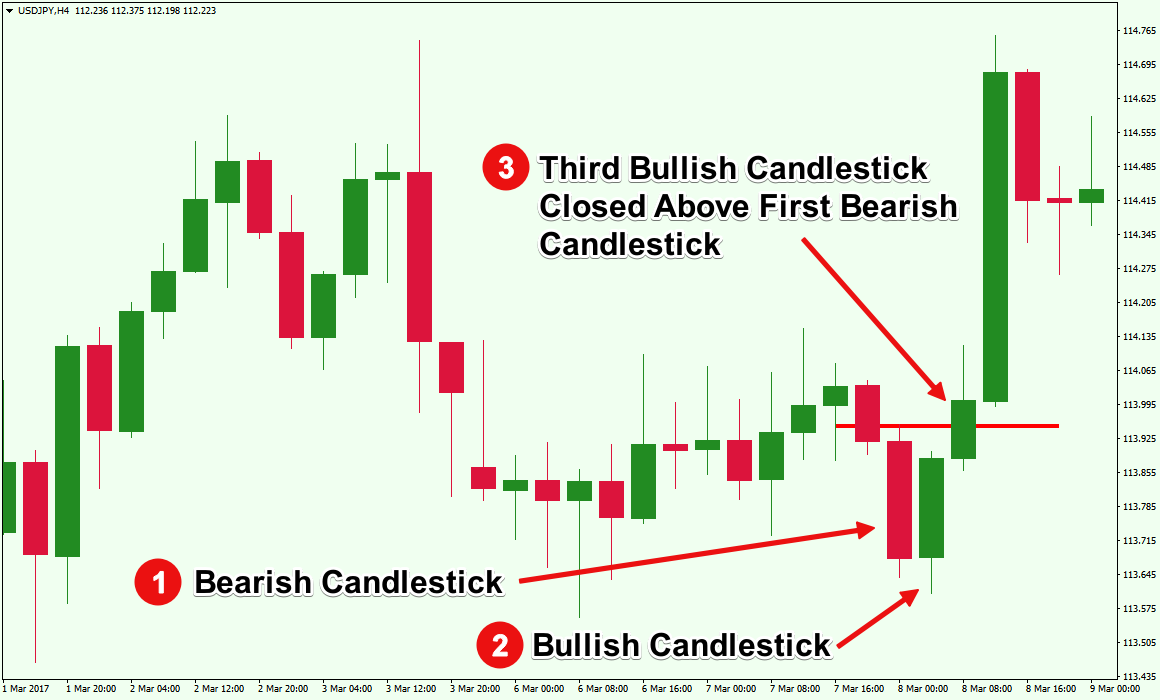
Figure 6: The Three Inside Up Pattern Can Signal a Bullish Trend
In order to form a Three Inside Up pattern, the first candlestick needs be a large bearish candlestick and the second candlestick needs to be a bullish candlestick that is inside the body of the first candle. Please keep in mind that the second bullish candlestick must reach at least the middle of the first bearish candlestick, as in figure 6. Once these criteria are met, the third candlestick also needs to be a bullish candlestick, and it must close above the first bearish candlestick. Once you find a combination of three candlesticks at the bottom of a downtrend, where these three criteria are met, you can be pretty sure that you have found a Three Inside Up pattern. Now, once the price breaks above the high of the third candlestick, you can place your buy order.
As you can see in figure 6, once the USDJPY price broke above the high of the third candlestick, it triggered a large bullish movement in the market. In this case, if you had placed a pending buy order just above the high of the third candlestick, your trade would have yielded some decent profits.
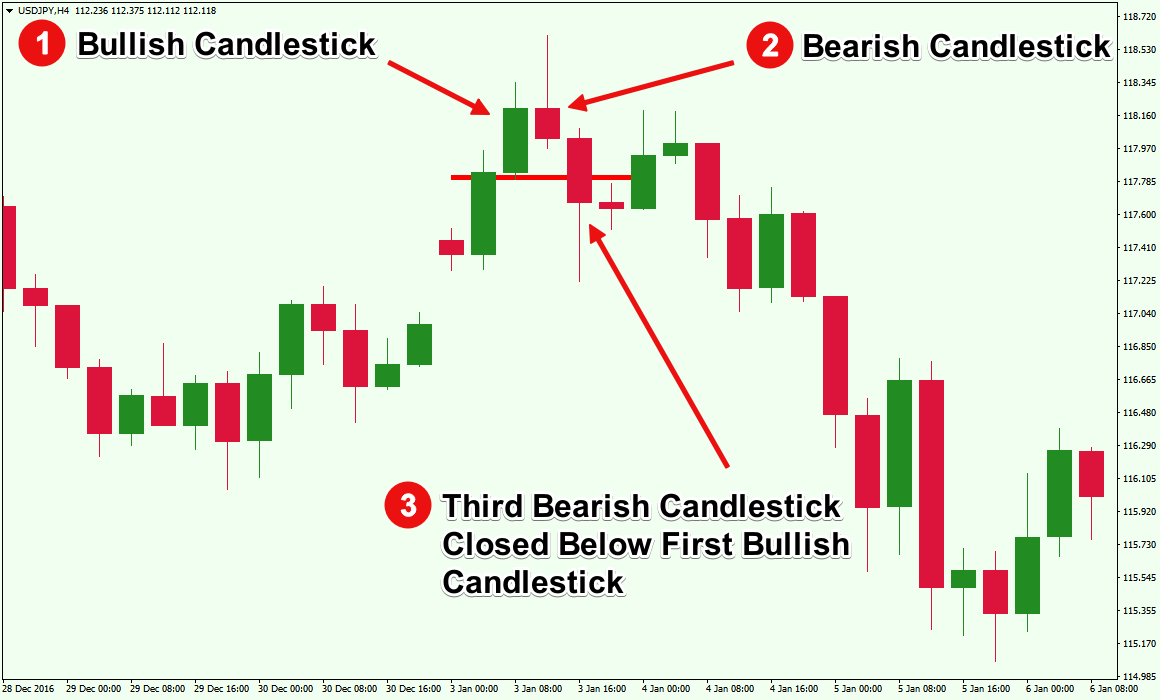
Figure 7: The Three Inside Down Pattern Can Signal a Bearish Trend
In figure 7, the first candlestick is a large bullish candlestick, which is followed by a bearish candlestick whose body is contained with the first candle. The second bearish candlestick reached below the middle point of the first bullish candlestick. Furthermore, the third bearish candlestick penetrated below the low of the first bullish candlestick and closed below it. Therefore, you can confidently identify this three-candlestick combination as a Three Inside Down pattern.
The Best Way to Trade a Triple Candlestick Pattern
The best way to trade any three candlestick pattern, would be by placing a pending buy or sell order just above the high or below the low of the third candlestick once the third candlestick closes. This way, you do not need to sit in front of the computer hoping to place the order once the price makes a move.
With a pending order, your broker will trigger the order automatically according to your original plan, which not only saves time but also ensures that you enter the market at the precise moment the price penetrates above or below the third candlestick. Make sure to set a predefined stop loss and profit targets, and then its best to just move away from the computer screen.
Psychology Behind Candlestick Patterns
If you have been trading Forex for a while, there is a good chance that you are familiar with the idea of chart patterns as well as have some basic understanding of how support and resistance levels work.
As history repeats itself, the price action in the market also has a tendency to repeat itself. When the price of a Forex pair breaks below a support level, it turns into a resistance level and Forex traders begin to watch these critical pivot zones. Similarly, when a candlestick chart pattern appears, Forex traders try to identify the pattern and interpret the future direction of the price based on how the market reacted when similar patterns appeared in the past.
While some traders rely on technical analysis alone, chart and candlestick patterns can work very well when combined with fundamental data points.
For example, let’s assume that the weekly US unemployment claims figure came out significantly higher compared to the analysts’ consensus forecast while the EURUSD was in an uptrend. As unemployment claims went up, it indicated that more people lost jobs that week than previously expected, which is usually bad news for the US economy. Therefore, it would likely have a bearish fundamental effect on the uptrend.
Let’s assume the EURUSD formed an Evening Star triple candlestick pattern at the same time, which is a bearish reversal candlestick pattern. The formation of this bearish three-period pattern in confluence with the unemployment claims data would provide strong support for a short trade.
Conclusion
Once you have learned the logic behind some of the most important triple candlestick patterns, you can start using a candlestick pattern indicator that will automatically identify the patterns for you. There are several custom pattern indicators for popular charting software in the market, including the MetaTrader 4 platform. Some of these custom indicators are even freely available for download in various forums, and you can buy a handful of professionally developed indicators as well.
Regardless, these indicators will only help you scan the charts, but keep in mind that you should always confirm the validity of the candlestick patterns so that you are not risking any money based solely on what a software program says. You should use these candlestick pattern indicators as a decision support system and should not allow the indicator to make trading decisions for you.