If you are a fan of pure price action Forex trading using candlestick patterns, then this lesson will be of particular interest to you. Today we will discuss a powerful candlestick formation which can often precede a sharp price move.
This formation that I am referring to is the Inside Bar pattern. We will discuss the structure of the inside bar setup and the psychology behind it. And finally we will go through a few of inside bar variations that you should become familiar with.
What is an Inside Bar ?
The inside bar is a two bar candlestick pattern, which indicates price consolidation. In order to confirm this pattern you need to see a candle on the chart, which is fully contained within the previous bar. In this manner, the inside bar candle should have a higher low and a lower high than the previous candle on the chart.
The Inside Bar is fairly easy to spot on the chart, but using an Inside Bar indicator can assist the trader in quickly finding these patterns on their price chart as well.
Psychology behind the Inside Bar
Since the inside candle has a lower high and a higher low than the previous candlestick on the chart, this indicates that the currency pair is consolidating.
Why is it consolidating? It is consolidating because the bulls cannot manage to create a higher high and at the same time the bears fail to create a lower low. As such, there is not sufficient buying or selling pressure to break the previous bar’s high or low.
Trading the Inside Bar Candlestick Pattern
Since the Inside candle on the chart is a sign of a consolidating market, we can draw a horizontal support and resistance level around this range in anticipation of a future breakout. When the price exits the inside bar range, we expect that the price action will continue to move in the direction of the inside bar breakout.
So as an informed price action trader, you should be looking for the break of the inside bar, which would provide a tradeable opportunity in the direction of the break.
Inside Bar Trading Techniques
The inside bar formation can be traded in a myriad of ways. What is most important is that the inside bar trading setup must adhere to pre-defined rules that the trader sets up per his own trading plan. We will discuss some examples of how a trader can approach setting up a trade when they see this pattern on their chart.
Entering an Inside Bar Trade
When the price action completes an inside candle on the chart, you should mark the low and high of the Inside Bar consolidation range. These two levels are used to trigger of a potential trade. Remember, the inside candle clues us in to the eventual breakout and likelihood of a continuation outside the range in the direction the break, however, it doesn’t give us information about the direction of the breakout through the range, prior to the actual move.
In simple terms, if the price action interrupts the range upwards, then you should go long. If the price action breaks the range downwards, then you should trade the short side.
Stop Loss when Trading Inside Bars
The usage of a stop loss order is recommended for any Forex trading strategy. The inside bar trading system is no different. You should always put a stop loss when trading inside candles. But where?
The proper location of your stop loss is slightly beyond the inside candle’s top, or bottom, depending on the direction of the break. In other words, if the inside range gets broken upwards, you can buy the Forex pair and place a stop loss order right below the lower candlewick of the inside candle.
The same is in force for bearish breakout of the inside range, but in the opposite direction. In this case you could sell the Forex pair and you put a stop loss right above the upper candlewick of the inside bar.
Take Profit on Inside Bar Setup
Projecting the potential move with Inside Bar Breakouts can be challenging. Often Inside Bar trades can lead to a prolonged impulse move after the breakout, so employing a trailing stop after price has moved in your favor is a smart trade management strategy.
Along with this, I typically like to use a fixed Take Profit target at 1.5:1 or 2:1 reward to risk ratio to scale out of inside bars trades. In this manner, if the stop loss is 80 pips from the entry, then the minimum target would be located at 120 pips distance.
Let’s take a closer look at the inside bar pattern on the Forex chart below:
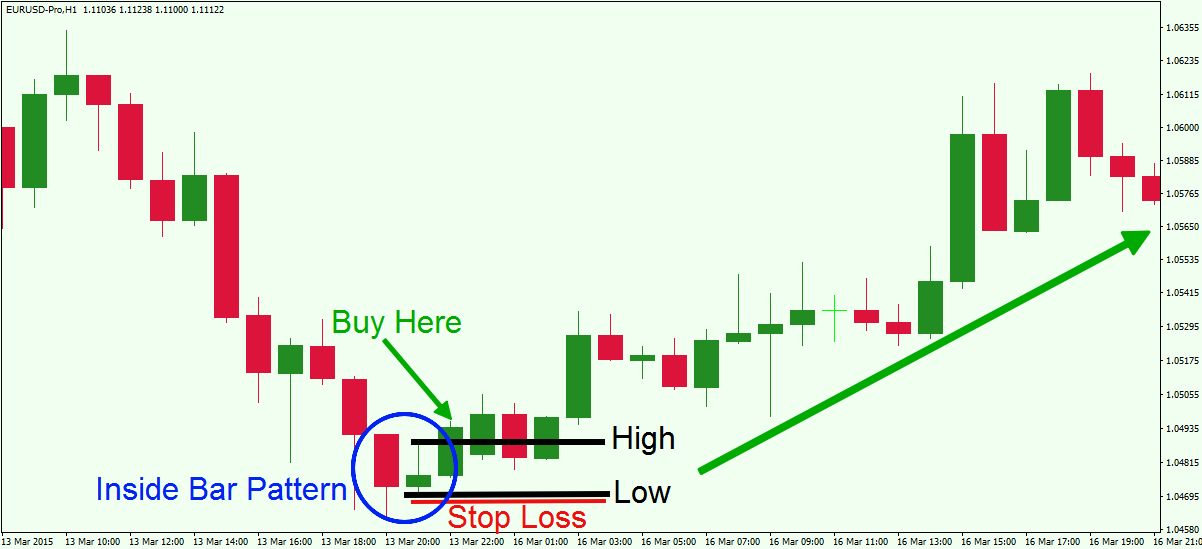
This is the H1 chart of the EUR/USD. The blue circle on the price graph above shows an inside bar candlestick pattern. See that the highest and the lowest points of the small bullish candle are fully contained within the previous bearish candle. This confirms the inside bar pattern on the chart. The black horizontal lines on the image define the inside bar range – the high and the low of the pattern. When you spot a breakout through one of these two levels, then that would give you a signal in the direction of the breakout. In our case the price action breaks the inside range in bullish direction. Conservative traders should consider buying the EUR/USD when the price action closes the next candle above the upper level of the range. Aggressive breakout traders would consider buying when the price reaches a few pips above the inside candle high. In either case, your stop should be located below the bottom of the range as shown on the image.
As you see, the price accounts for a strong run up after the inside bar pattern breaks to the upside.
Inside Day Breakout
One of the highest probability time frames to incorporate the Inside Bar Pattern is on the Daily Chart. When an Inside Bar Pattern appears on the daily timeframe, this is often referred to as an Inside Day pattern. It is identical in appearance to any other inside bar pattern, however, the Inside Day setup concerns a daily chart and responds to the trader’s behavior during one full trading day. When you see an inside day pattern on the chart, this means that on a daily basis, the traders have failed to establish bullish or bearish control in relation to the previous trading day
In essence, the inside day candlestick has the same structure and attitude as the regular inside bar, but it is considered more reliable due to the fact that each candle encompasses a full day of trading activity. See the image below for a depiction of the Inside day pattern.
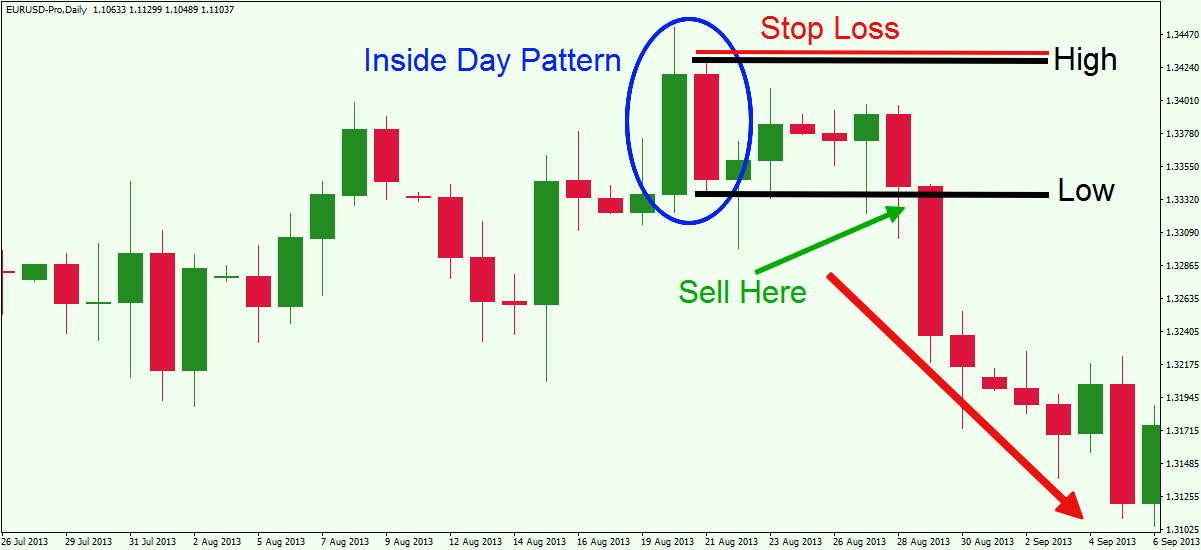
Above is the daily chart of the EUR/USD. The image shows an inside day trading setup.
The blue circle indicates the inside day pattern. The black levels point out to the pattern’s high and low. The green arrow shows the successful breakout of the inside day formation. Note that we did have two prior attempts to break to the downside, which did not follow thru immediately. The initial breakout turned out to be a Pin Bar formation. But the third attempt proved to be successful. But regardless, if we had followed our stop loss placement rules, then we were never in any danger of getting stopped out for a loss on this trade.
To reiterate, the stop loss on this short trade should be located above the high point of the inside day as shown on the image above.
As you see, after the bearish inside day breakout the price initiates a sharp decline, which could have been traded for a decent profit.
Inside Day Breakout with Narrow Range (ID NR4)
We will now shift our attention to another variation of the inside day trading pattern. This is the inside day coupled with the narrowest range of the last 4 days (NR4). This pattern was originally popularized by Toby Crabel in his book entitled: “Day Trading with Short Term Price Patterns & Opening Range Breakout”. This book is a true classic, and is usually listed on Amazon for anywhere from $300-$400. Crabel is the founder of Crabel Capital Management, LLC, and currently as of this writing has over $1 billion in assets under management.
In order to confirm the Inside Day / Narrow Range of the last 4 days ( ID NR4 ) pattern, you will need to have and Inside Day Candle, which is also the narrowest Range Candle within the last 4 days.
Though this might seem a bit confusing at first, it is quite simple once you take a bit of time to understand it.
This ID NR4 trading pattern is quite a prolific and reliable setup that astute traders can take advantage of. The power of this formation is hidden in the consolidative character of the formation. Since the inside day candle is also the smallest of the last four daily sessions, this means that the range is relatively tight and it is likely to break out with a sharp reaction.
The trade entry characteristics of this pattern fully match with the typical inside bar methodology. Let’s see an Inside Day / Narrowest range of the last 4 days’ pattern ( ID NR4 ) on a price chart:
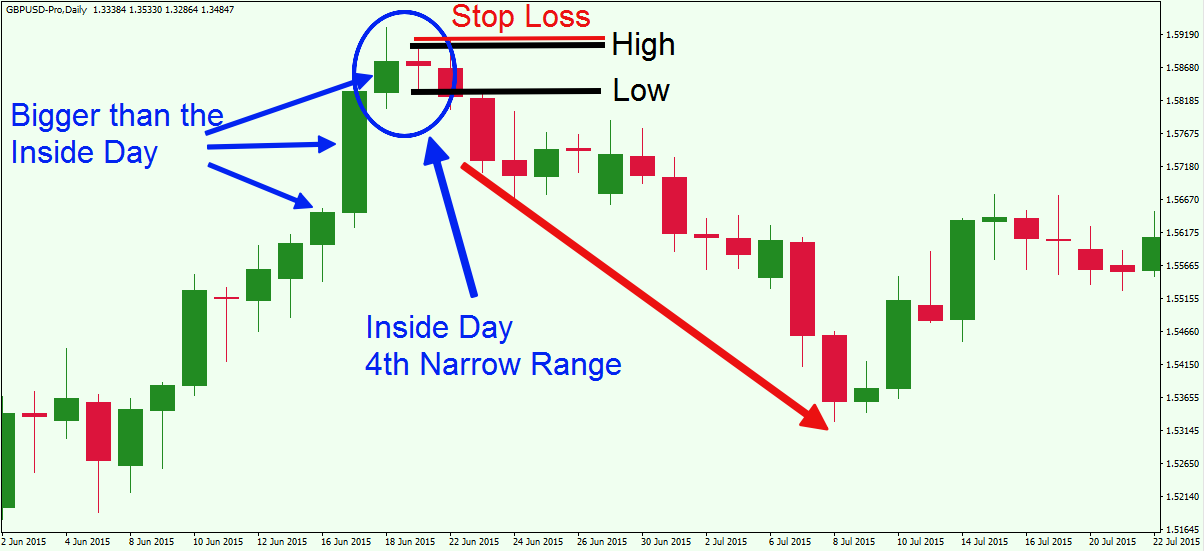
We are now looking at the daily chart of the GBP/USD. The image demonstrates an inside day with narrow range a.k.a the ID-NR4 Pattern.
The blue circle on the image points to the inside day candle. Also take note of the three blue arrows at the left side of the image, which shows that the previous three candles on the chart are actually bigger than the inside candle. Therefore, we confirm that the inside candle is also the narrowest range day of the last 4 daily sessions.
We mark the inside candle’s high and low as in the previous two examples (the black lines). A conservative trader would identify the ID NR4 breakout when the price action closes a candle below the bottom of the pattern. An aggressive trader would identify the ID NR4 breakout when the price reaches a few pips below the bottom of the pattern. In each case, it would signal that the consolidative range is ending in favor of a downward price movement. A trader could prepare to enter a short position, and put in a stop loss above the high point of the pattern as shown on the image.
As you see, after the short signal, the price accounts for a strong decrease.
Hikkake Pattern
The Hikkake pattern is another variation of the inside bar candlestick. However, it represents an Inside bar pattern failure. As you already know, in Forex trading nothing is 100% certain. Patterns can and do fail, but many times these failed patterns can offer nice trading opportunities for those whose are quick to recognize the fakeout.
When you discover an inside bar breakout on the chart, you will most likely want to trade in the direction of the breakout. However, the pattern could turn against you. The price action might reverse direction and quite possibly could break the range of the pattern from the opposite side. This will trigger your stop loss, because it should be located on that side of the range. Therefore, you will be stopped out of the position with a small loss.
However, if this happens you should look to see if there is an Inside bar failure pattern emerging. In this next section we will take a closer look at the Hikkake pattern, which is an inside bar fakeout. When you see this pattern, you should position yourself in the market to trade in the opposite direction to the one which you had previously placed.
The Hikkake pattern is confirmed when there is an Inside Bar pattern, a breakout of the inside bar on the next candle, and then a reversal occurs, and breaks thru the opposite end of the Inside Bar. It is important that the breakout thru the opposite side occur within 2-3 bars of the original breakout.
For example, If the inside bar breakout is bullish, you will typically want to buy the Forex pair. However, if price turns against you and it breaks the lower level of the inside range within the next 2-3 bars, and triggering your stop loss, then you would want to consider reversing your position and going short. I like to put a stop loss above the highest point of the inside bar and set a 2:1 reward to risk target for ½ the position, and then use a trailing stop on the other ½ of the position.
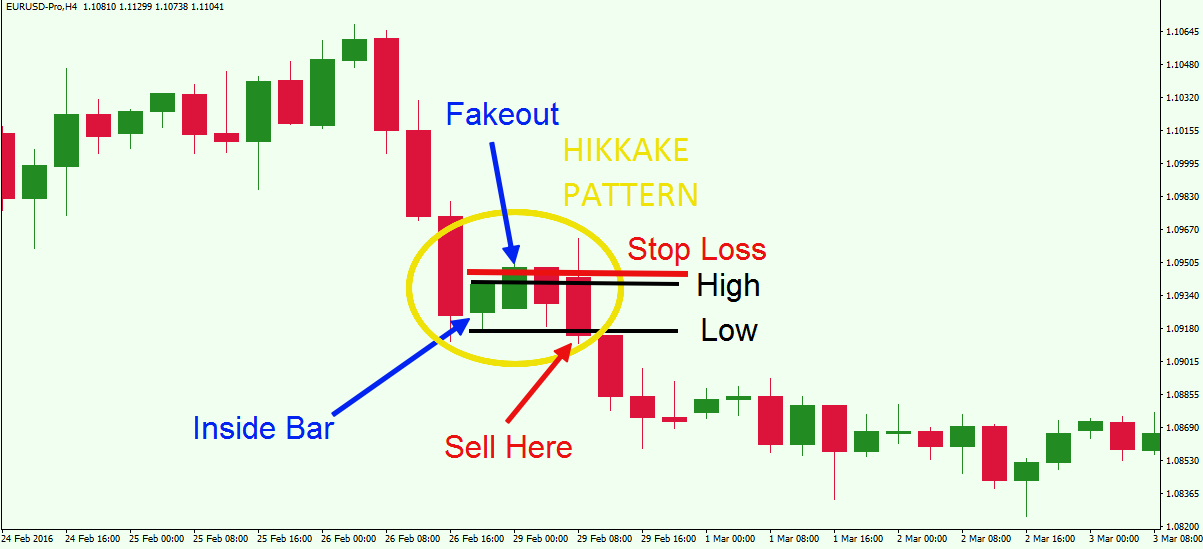
This is the H4 chart of the EUR/USD. The image illustrates an inside bar on the graph, followed by a Hikkake pattern.
During the initial decline, the price action creates an inside bar candle formation on the chart. Thus we can mark the high and the low level of the inside range. These are the two black lines on the chart. The next candle which comes after the inside bar breaks the upper level of the range. This gives us an initial long signal on the chart. As you see, the price begins to reverse afterwards, and within the next two bars, the price decrease leads to a break of the lower level of the range. This confirms the Hikkake pattern on the chart, and with that, we should get ready to initiate a trade to the short side.
When we short the EUR/USD, we would want to place a stop loss order above the upper level of the inside range. As you see in this example, the EUR/USD decreases afterwards making this Hikkake trade a profitable deal.
In the examples provided throughout article, you saw that the standard inside bar and its variations can provide very attractive price action setups. And any trader, regardless of their trading style, can take advantage of and incorporate these patterns into their trading methodology.
Conclusion
- The inside bar candle pattern is a simple, effective price action trading setup.
- The inside bar is a candle in which the body is fully contained by its preceding candle.
- The Inside Bar formation suggests that the market is pausing or consolidating. The bulls cannot create pressure for a higher high and the bears cannot create a lower low.
- You can trade the inside bar setup in the following way:
- Buy the Forex pair when the price action breaks the upper level of the Inside Bar range.
- Sell the Forex pair when the price action breaks the lower level of the Inside Bar range.
- When you trade an inside bar, you should always use a stop loss order.
- When you are buying, the stop loss should be located below the lowest point of the inside bar.
- When you are selling, the stop loss should be set above the highest point of the inside bar.
- The inside day is a type of an inside bar pattern. However, it represents a daily timeframe and it conveys the pair’s directional hesitation during the entire trading day.
- The inside day with narrow range is an inside candle which also has the smallest day range among the last four days. This indicates that the range is shrinking and is due for a volatility expansion.
- The Hikkake candle pattern represents the failure of the inside bar. When the inside bar pattern fails and returns to break the opposite level of the range, within 2-3 bars, we confirm a Hikkake pattern. In this manner, we can trade the Forex pair in the opposite direction to the initial Inside Bar trade entry. The stop loss in this case should be placed on the opposite level of the inside range.