There are many resources where you can find information on using and trading with traditional western methods. However, it seems there is not as much material written on some of the more popular eastern trading techniques.
So in this lesson, we will take a closer look at the Ichimoku Cloud, a somewhat mysterious chart indicator, favored among many Japanese traders.
We will start our discussion with what the Ichimoiku cloud is, and then move into learning about how it is calculated and plotted, and finally I will present some practical strategies for trading with it.
What is Ichimoku Cloud ?
The indicator consists of three lines which have Moving Average functions and an area, called the “Cloud”.
The Ichimoku cloud indicator is also sometimes referred to as Ichimoku Kinko Hyo or Kumo Cloud.
Let’s now have look at a naked Forex chart and compare it to a chart with the Ichimoku cloud indicator.
Below you will see a standard chart of the EUR/USD Forex pair.
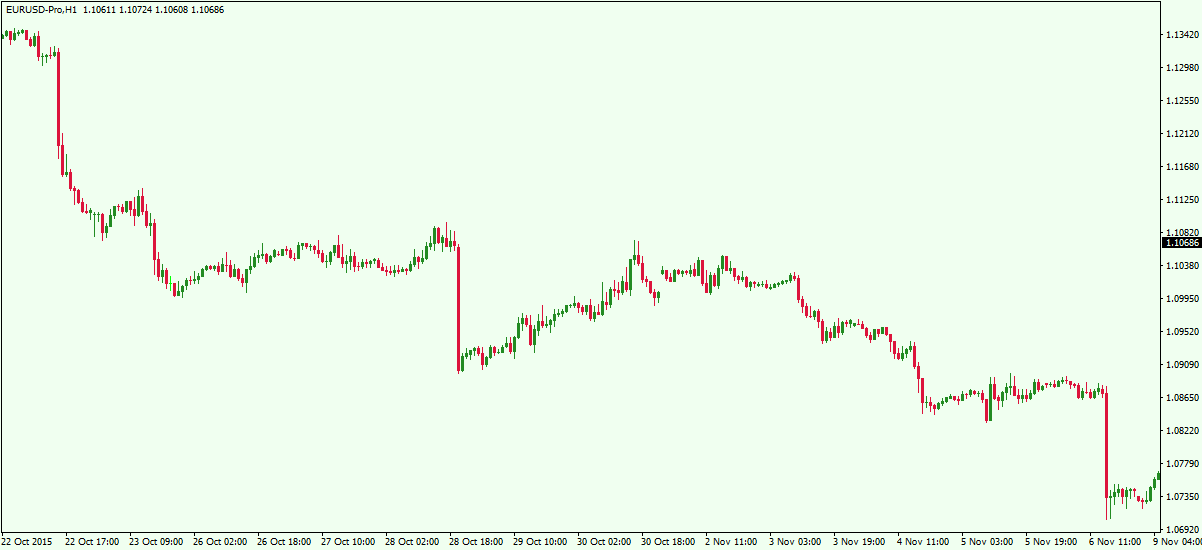
It is a stripped down chart; we can clearly see that the price action is moving along in a bearish trend. Now let’s add the Ichimoku Cloud on the chart and see what happens:

“Well, isn’t that a mess?” This is what most traders think when they first come across the Ichimoku Cloud indicator. There the three Moving Average lines – red, blue, and green. You also see the Cloud, which consists of the orange area on the chart. Although it looks quite chaotic to the untrained eye, to the Ichimoku trader, there is clarity within the chart.
Ichimoku Calculation
So, as you can see from the Ichimoku chart above, there are three lines and the Cloud. Since the Cloud is formed by an upper and a lower level, we have a total of 5 lines on the chart. Each of these lines has Moving Average functions, and the lines do take into consideration past data from a certain number of periods on the chart, but there are also some distinct differences between the Ichimoku and the standard SMA, or EMA. The default parameters of the Ichimoku tool are 9, 26, 52. The following explanation regarding the structure of each line will move you closer towards understanding how the Ichimoku is constructed.
Chinoku Span
The green line on the Ichimoku Indicator is called a Chinoku Span. If you have a look at the green plotted line on our chart above, you will notice that the green Chinoku Span mimics the price action of the currency pair. However, the line is displaced to the left by 26 periods. In this manner, the Chinoku Span line is a displaced lagging component within the Kumo Cloud structure.
Tenkan Sen
The Tenkan Sen is the red line on the Ichimoku Indicator. This line has Moving Average functions as well. It takes into consideration the highest and the lowest points on the chart for a 9 period time frame. The Tenkan Sen displays a mid value of the two periods, which form the high/low on the chart among the last 9 periods.
Kijun Sen
The blue line of the Ichimoku Cloud is called Kijun Sen. This line has absolutely identical functions as the red Tenkan Sen. The only difference is that the Kijun Sen considers 26 periods instead of 9. The blue Kijun Sen creates a mid value between the highest and the lowest period on the chart, among the last 26 periods. Since the Kijun Sen takes more periods into consideration than the Tenkan Sen, it is slower and it reacts later to price moves.
The “Cloud” (Senkou Span)
As we said, the Cloud is the orange area on this Metatrader chart illustrated above. Notice that it is formed by an upper and a lower level, consisting of two lines.
The first line forming the Cloud averages the highs and the lows of the Kijun Sen and the Tenkan Sen. Also, the line is displaced 26 periods forward (to the right).
The other line of the Cloud shows a midpoint of the highs and the lows on the graph for a 52 period timeframe. As with the other line of the Cloud, this line is also displaced by 26 periods to the right.
These two lines constantly interact with each other. Furthermore, since there is an equal displacement, it tends to keep the two lines in close proximity of each other.
Trading with Ichimoku in Forex
Now that we are familiar with the structure of the cloud chart, we will now go through some Ichimoku trading signals. The usage of a stop loss when trading with Ichimoku is recommended, so that you will be protected from any rapid price moves in the opposite direction. However, we won’t suggest a specific location for your stop loss placement when trading with the cloud. You can simply place it at a relative distance, based on current volatility, beyond the cloud so that the price won’t hit it during normal market fluctuations.
For Ichimoku style trading, we will want to use the lines of the indicator to close our trades rather than using fixed targets or trailing stop loss orders. Let’s now discuss a few Ichimoku cloud trading systems.
Cloud – Kijun Sen Trading Strategy
In this Ichimoku Clouds trading strategy we will enter the market when the price breaks out of the Cloud. We will enter in the direction of the breakout, attempting to catch a trend.
When the price starts trending in our favor, we will continue to stay in the trade until the price action breaks the blue Kijun Sen in the opposite direction. Below you will see the way this trading strategy works:
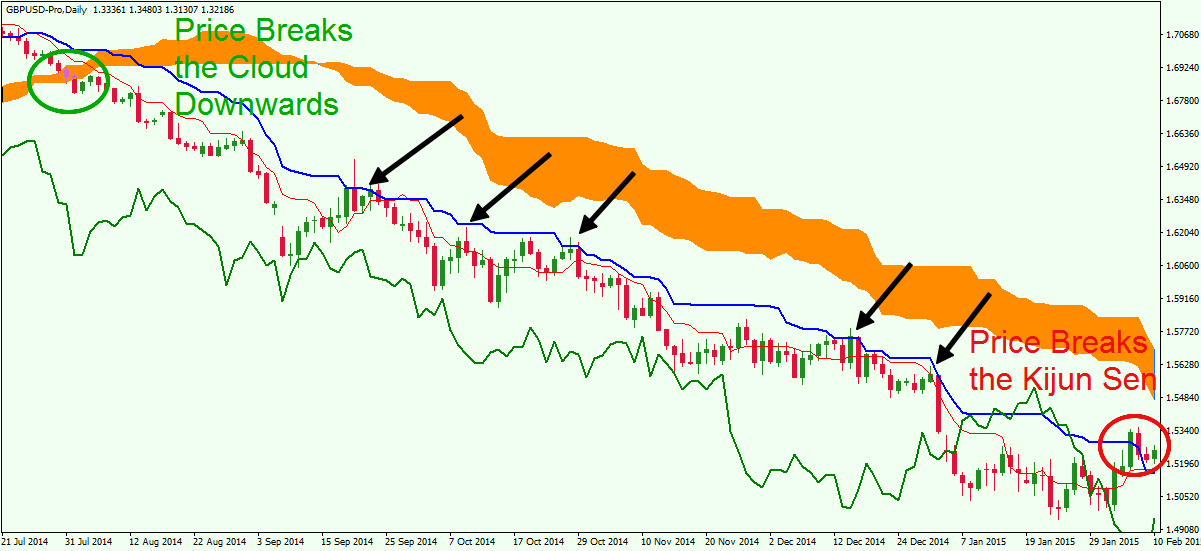
This is the Daily chart of the GBP/USD for the Jul 2014 – Feb, 2015. The image shows a classic downtrend, which could be traded using this Ichimoku pattern setup.
The chart begins with the price action moving below the orange Cloud. This gives a sell signal on the chart and an Ichimoku trader would be looking to short the Cable.
See that the price enters a bearish trend afterwards. The decrease is relatively sharp. On the way down the price action creates a few corrective moves, which nearly gets the GBP/USD price through the blue Kijun Sen.
However, the price finds resistance at the blue line and continues its downward direction. The black arrows on the chart show the moments when the price tests the Kijun Sen as a resistance. Since the breakout attempts proved unsuccessful, the short trade should be held further.
Six months after the short signal on the chart, the GBP/USD price breaks and closes above the Kijun Sen line upwards. This creates an exit signal on the chart. As a result, the short trade should be closed on the candle that closes above the blue Ichimoku line.
Cloud – Chinoku Span – Tenkan Sen Trading Strategy
In this Ichimoku Cloud trading method we will enter the market when the price breaks the Cloud. We will trade the Forex pair in the direction of the Cloud breakout trying to ride a trend. After the price starts trending in our direction we will hold the trade until the green Chinoku Span breaks the red Tenkan Sen. This is how it works:
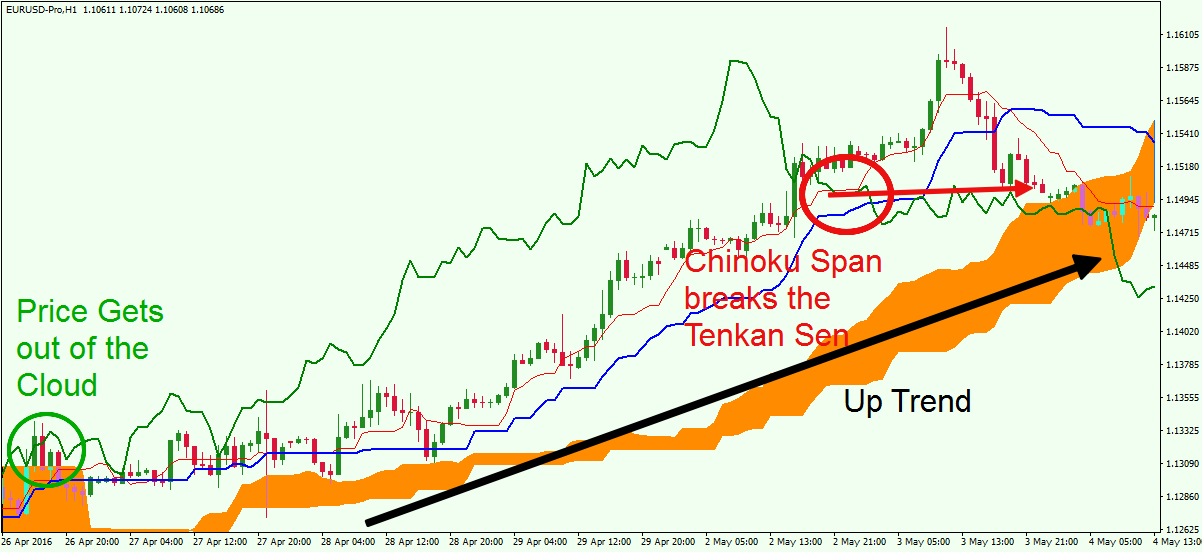
We are now looking at the hourly chart of the EUR/USD Forex pair for Apr, 26 – May, 4, 2016. The Ichimoku indicator is also attached to our graph.
The chart image starts with the price breaking out of the Cloud in a bullish direction. The green circle shows the moment when the price closes a candle above the Cloud. This is the buy signal we need in order to go long the EUR/USD Forex pair. As you see, the price starts trending upwards shortly afterwards.
Now we need to follow the green Chinoku Span. See that it starts trending upwards after the price action. During the upwards price move the green Chinoku Span gains relative distance from the price action. This confirms the strength of the bullish trend.
One week after the buy signal on the chart and the continuous uptrend, the price creates a top and starts a sharp decline. This reflects the move of the green Chinoku Span. After the establishment of the top, the price decreases enough to bring the green Chinoku line through the red Tenkan Sen. According to our strategy this is the close signal and the long trade should be exited at this time.
Cloud Trading Strategy
In the pure cloud technique, we will only use the Cloud for our Ichimoku Analysis. We will enter the market when the price breaks the Cloud. Our trade will be in the direction of the breakout. We will stay in the trade until the price move into the Cloud again and breaks it at the opposite level.
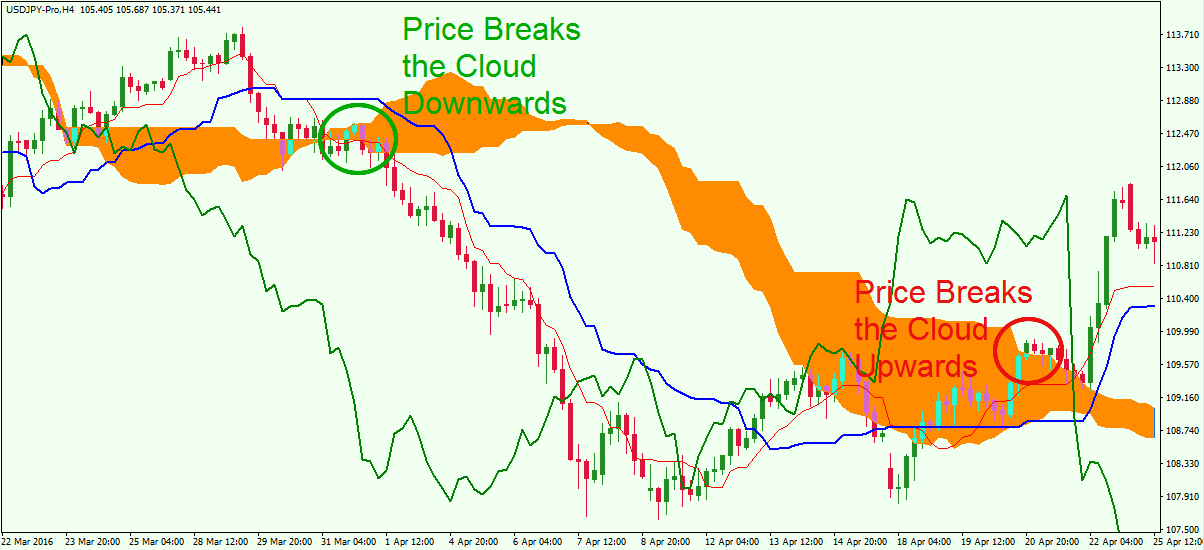
This price chart displays the 4-hour chart of the USD/JPY for March – April, 2016. The image shows that the price is in a down trend. We will implement the Ichimoku Cloud trading rules we just described for this example.
The image starts with the price switching above the Cloud and then quickly back below the Cloud. The downward breakout through the Cloud could be used to short the USD/JPY Forex pair. As you see, the price starts decreasing afterwards. The price drop is relatively sharp and the the USD/JPY starts losing steam after about 4.5% decline in its value. After the pair reaches a bottom, it starts consolidating, and then starts moving upwards, back into the Cloud. After a short hesitation in and out of the Cloud from the lower side, the price action breaks the Cloud in a bullish direction. This creates a very strong new long signal and a short exit signal on the chart as well. The short trade should be closed out when the price action closes a candle above the Cloud.
You will notice that the Cloud is the most lagging component of the Ichimoku trading tool. As a result, this strategy is very successful when the Forex pair is trending, but on the other hand, it can give you many false signals when the pair is consolidating. During ranges you will often see the price hopping above and below the Cloud creating a whipsawing effect with many false signals.
Take note that in these three trading strategies we only used the Ichimoku Cloud indicator and nothing else. Many traders, especially those based in Japan and other Eastern counties rely heavily or exclusively on this trading indicator for their trade analysis.
Also, you may have noticed that we used the Cloud component in each of our three trading strategies. This is so because the Cloud is the most important part of the Ichimoku indicator. The Cloud is typically used to open trades when trading with Ichimoku.
Customizing the Ichimoku Cloud Indicator
The Kumo Cloud tool is fully customizable. You can always remove and add components of the cloud indicator in order to best suit your trading style. If you are trading using the Cloud strategy, your Ichimoku indicator could be setup to look the following way:
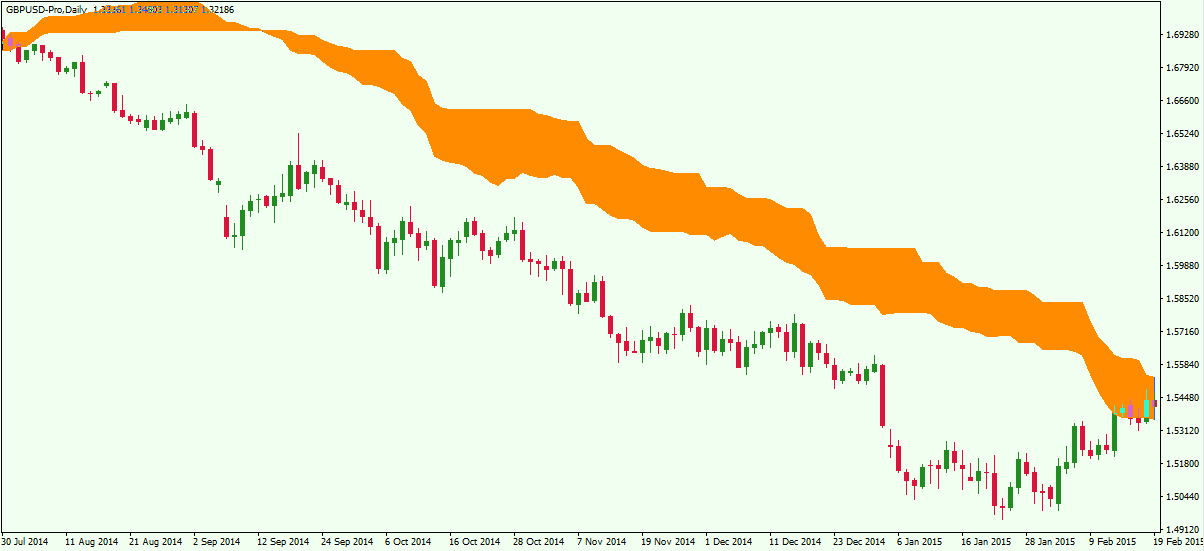
In this chart image you see that we only have the Cloud as part of the Ichimoku indicator. We have removed the Kijun Sen, the Tenkan Sen, and the Chinoku Span. If you prefer trading using just the cloud, then this chart template would provide a better visual to guide your trading. The same applies for the other two strategies we discussed earlier.
If you trade using the Cloud and the blue Kijun Sen, your chart could be setup to look the following way:
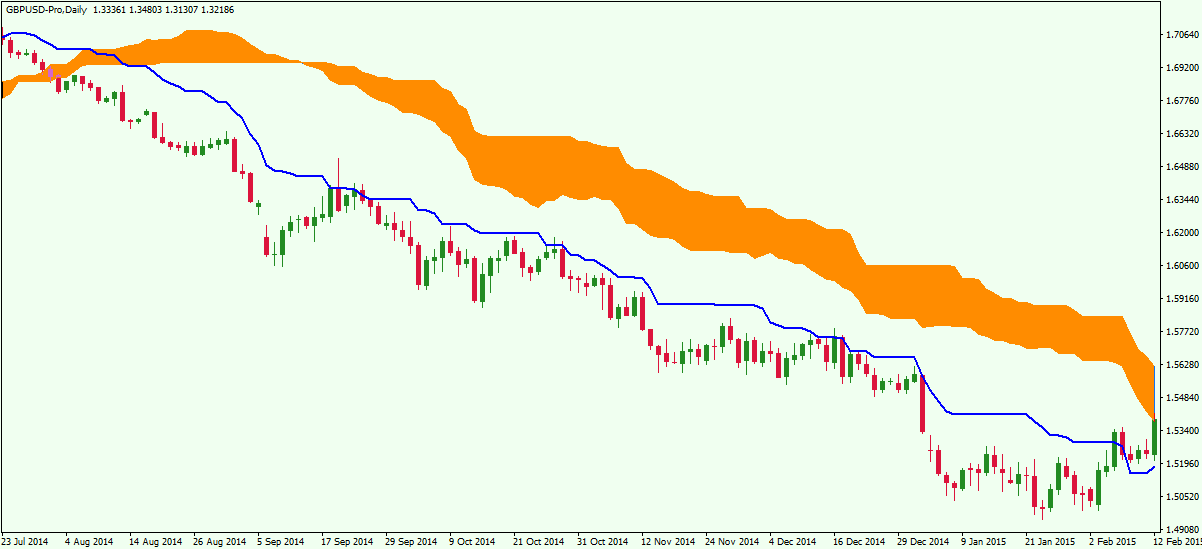
Note we have also added the blue Kijun Sen to the cloud in order to adapt the Ichimoku Cloud chart to our trading strategy. And so, the red Tenkan Sen and the green Chinoku Span are not plotted in this example.
Let’s now display a third option for chart customization using the Ichimoku indicator:
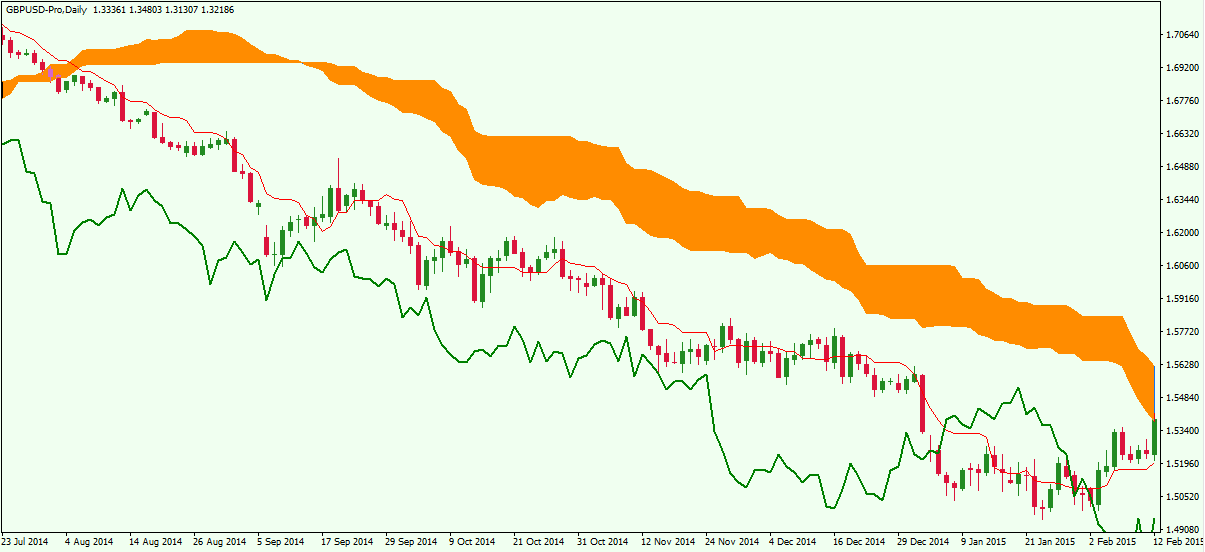
This time the Kijun Sen is gone. At the same time, we have added the red Tenkan Sen and the Chinoku Span. This way we will have a clearer picture if we want to implement this trading strategy.
As you see, the Ichimoku Cloud trading indicator can fully adapt to your needs. You can always add and remove components of the indicator. Also, if you are back testing an automated Ichimoku based trading system, you can always change the periods of the separate Ichimoku components to help with your optimization efforts. But make sure, that if you are performing optimization tests, that you forward test as well as back test the data set to avoid curve fitting.
Wrapping up, the Ichimoku indicator is one of the most underutilized but certainly useful trading tools available to the retail spot forex trader. When used properly, it provides a rich set of information, and strategy options, and it is fully customizable, to fit your trading style.
Conclusion
- The Ichimoku Cloud indicator is also referred to as Ichimoku Kinko Hyo or Kumo Cloud.
- The interaction between the different Ichimoku components creates different trading signals.
- The Kumo Cloud is a very good standalone tool. No additional tools are required when you are an Ichimoku trader.
- The Ichimoku indicator consists of three lines and a Cloud formed by other two lines.
- Kijun Sen – creates a mid value between the highest and the lowest period on the chart, among the last 26 periods.
- Tenkan Sen – displays a mid value of the two periods, which form the high/low on the chart among the last 9 periods.
- Chinoku Span – exact copy of the price action, but it is displaced backwards by 26 periods.
- The Cloud –The first line forming the Cloud averages the highs and the lows of the Kijun Sen and the Tenkan Sen. Also, the line is displaced by 26 periods forwards (to the right). The other line of the Cloud shows a midpoint of the highs and the lows on the graph in a 52 period timeframe. It is also displaced forward 26 periods.
- Three Ichimoku trading strategies include the following:
- Enter when the price breaks the Cloud in the direction of the breakout. Stay in the trade until the price breaks the blue Kijun Sen in the opposite direction.
- Enter when the price breaks the Cloud in the direction of the breakout. Stay in the trade until the green Chinoku Span breaks the green Tenkan Sen in the opposite direction.
- Enter when the price breaks the Cloud in the direction of the breakout. Stay in the market until the price breaks the Cloud in the opposite direction.
- It is recommended to use a volatility based stop loss order in each of these strategies.
- Ichimoku strategies tend to work best when the Forex pair is trending, rather than during consolidative phases.
- The Ichimoku Cloud indicator is fully customizable. You can always remove some of its components, or adjust the periods, to suit your personal trading style.