Trading pullbacks in a trending market is one of the most time-tested Forex trading strategies out there. The beauty of a well thought out pullback trading system is that you enter the market or place your first trade only after confirming which way the market is going. Doing this is going to help you eliminate entering the market with a false signal, where the price of the Forex pair initially appears to be going in a particular direction, but then suddenly makes a sharp u-turn.
Since currency pairs remain within a range bound or consolidation phase most of the time, and the market trends only about 20 percent to 30 percent of the time, finding an established trend to trade pullbacks in can be a challenging task.
As a Forex trader when you are trying to apply a pullback trading strategy, you need to act like a sniper. You need to wait, then wait some more, sometimes for hours – if not days – before pulling the trigger.
Consequently, you need to make sure that you have identified the possible turning point, where the retracement move is likely to end. You need to find a way to generate a high probability pullback signal where the price is likely to resume the prevailing trend.
If you can successfully apply a pullback trading system, you can buy low during an uptrend and sell high during a downtrend. This means your stop loss could be much closer to your entry if you place the order during a pullback or retracement compared to placing the order when the price was moving in the direction of the trend.
So, in a nutshell, there are three basic steps that you need to take to successfully trade pullbacks within a trend:
- Identify an existing trend
- Identify potential reversal areas or market conditions where the retracement of the trend may resume the prevailing trend
- Apply a pullback trading strategy that offers high-quality trading signals to time your market entry so that you are executing a trade that offers a high reward to risk ratio.
Nevertheless, before we dive into discussing real world scenarios and examples, you should get familiar with the theoretical aspects of why trading pullbacks during a trending market work in the first place.
Why the Trend is Your Friend
If you have been trading Forex for a while, you have certainly heard the wise axiom that “the trend is your friend”. However, professional Forex traders also know that the trend is only your friend “until it ends”.
You see, most of the time the Forex market remains in equilibrium, where major market participants have access to all the major news developments and information about a particular country’s currency. As a result, the Forex pair’s price fluctuates a bit throughout the day, but absent of any new information, it usually doesn’t have any particularly strong directional movement.
However, after high-value news releases about economic fundamentals, if the actual data diverges from the market’s consensus, we can see sharp price movements because here, the market is trying to interpret the new information to find a new equilibrium.
Bulls and Bears sometimes have a unique interpretation of developing economic fundamentals, and they put their money behind their respective interpretations. When the majority of the market participants or even a few large institutional players believe the price should go up or down, this supply and demand imbalance can act to drive prices sharply higher or lower.
If you have ever watched Level II order flow, you can see how the price triggers each order as prices are moving up or down. Now, once the market starts pushing the price up or down, and establishes a trend, at some point, some traders would start taking profit off the table. They may be thinking that the price will not go much higher or lower, or they just simply want to secure some of their earned profit. Regardless of the motivation, these trading decisions can decrease the trend momentum, and as this happens we start to see pullbacks emerging in the market.
Often, you would see that these pullbacks come close to a previous consolidation zone or pivot points on the chart. Often these pullbacks test a prior Support and Resistance level. Since Forex traders know these levels have previously acted as pivot zones, a large amount of pending orders accumulate around these price levels.
As a result, when a pullback of the trend reaches these price levels and if there were sufficient orders in the market in the direction of the trend, the market resumes the trend. Otherwise, the support or resistance levels break, and a trend reversal may ensue in the market.
Remember that while identifying a trend can be relatively easy using a naked chart or with the aid of a few technical studies, knowing if the trend is strong enough or gauging the probability of the trend to continue after a pullback is a bit more difficult to accomplish. Having said that, it is quite doable if you apply the right technical analysis tools and have a comprehensive strategy to trading pullbacks.
For most new traders, it is strongly recommended that at the beginning stage that they try to stick to trading pullbacks in a trend rather than engage in counter trend or mean reversion methods. The best aspects of trading pullbacks during an established trend is that even if the price of the Forex pair goes beyond your initial entry point, you will typically have a chance at re-entries.
However, as you gain more experience trading pullbacks in the forex market, you can then move on to developing more sophisticated strategies to compliment your trend pullback strategy. But again, if you are a newbie, then you would do best to start by focusing on picking the low-hanging fruit, which in this case is trading pullbacks during a trending market.
Identify the Underlying Trend
The first step towards learning how to trade pullbacks is to recognize a trend. If the price on the left of the chart is lower than it is on the right, and making higher highs and higher lows, then you are watching an uptrend in action. On the other hand, if the price on the left of the chart is higher than it is on the right, and making lower highs and lower lows, then you are watching a downtrend. It is that easy to identify an underlying trend in the market and something that all traders should be able to do rather quickly. You can also use two moving averages and confirm the trend when a crossover happens as well as use it as a confirmation of the pullback resuming the prevailing trend.
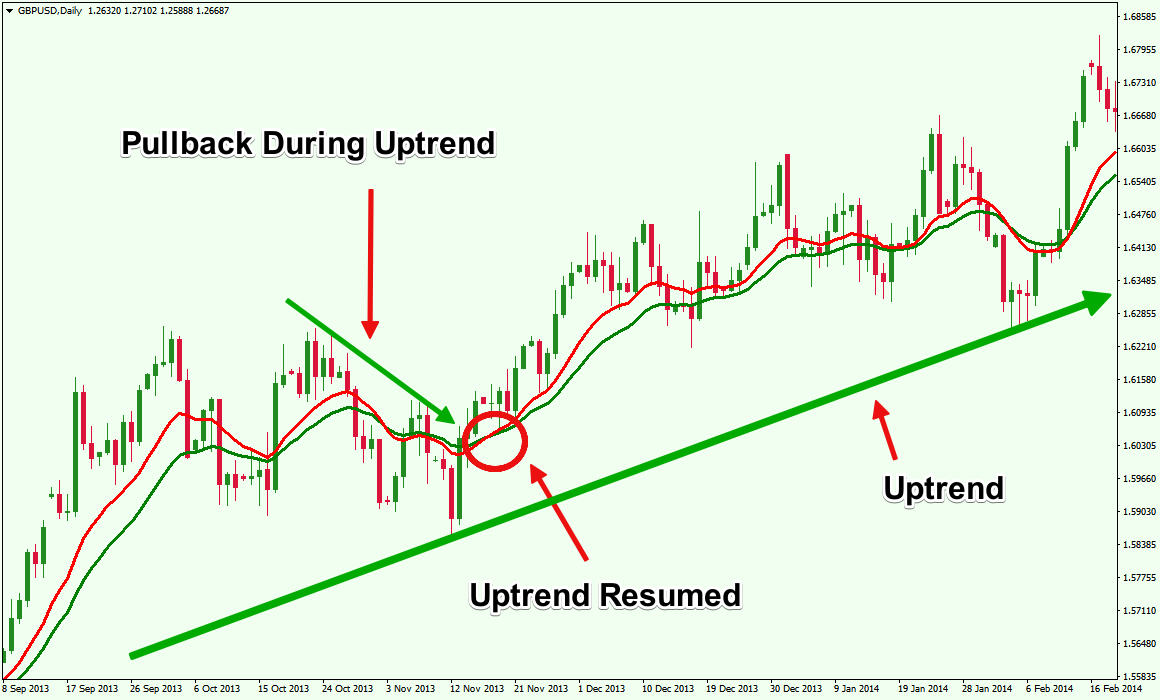
Figure 1: Moving Average Crossover Confirms When a Pullback Resumed During an Uptrend
In figure 1, you can see the GBPUSD was on an uptrend, as identified by the Green uptrend line. However, by adding two moving averages, a 13-period Red EMA and a 21-period Green EMA, we can confirm the temporary momentum in the market.
When the Red EMA crossed below the Green EMA, it signaled a pullback. As soon as the Red EMA crossed back above the Green EMA, it indicated that the GBPUSD pullback has ended and the uptrend resumed.
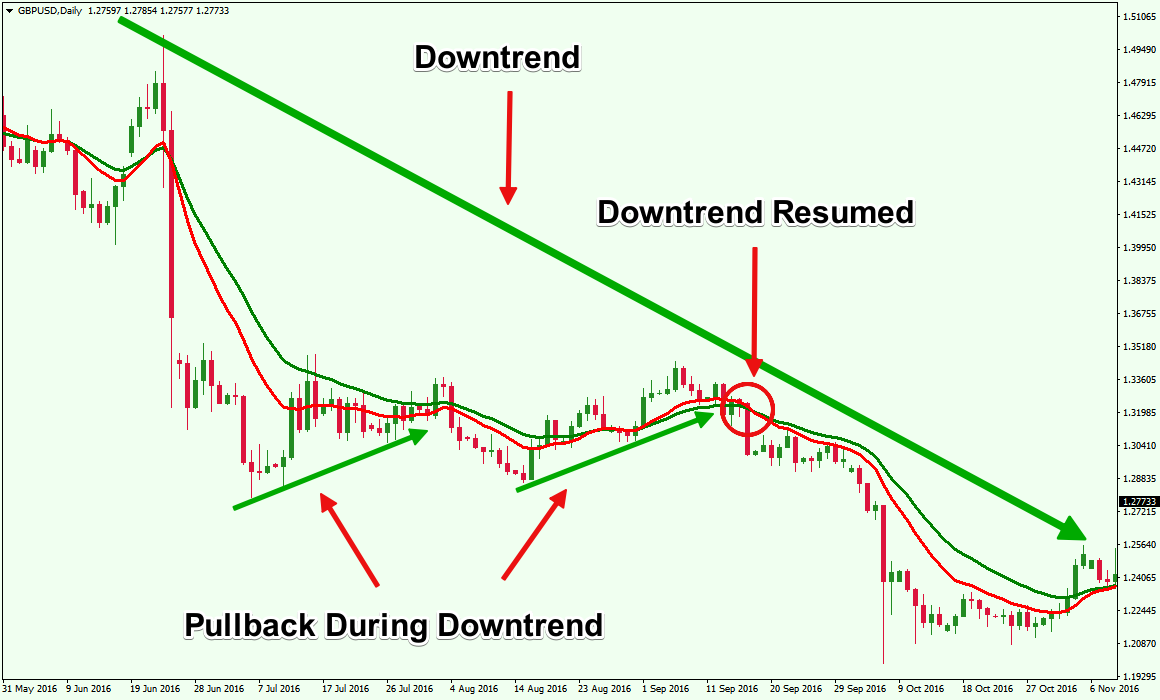
Figure 2: Moving Average Crossover Confirms When a Pullback Resumed During a Downtrend
Similarly, in figure 2, we can see that when the Red EMA crossed above the Green EMA, it signaled a pullback. As soon as the Red EMA crossed back below the Green EMA, it signaled that the GBPUSD pullback has ended and the downtrend resumed.
However, there is a major shortcoming of using EMA crossovers for spotting a pullback or trigger a market entry. If the pullback momentum is not that strong, like in the first instance in figure 2, the EMA crossover might never happen, and the trend may resume, leaving you wondering when to enter the market.
Furthermore, an EMA crossover acts as a lagging indicator, and by the time it generates a signal, the market may have moved quite a bit in the direction of the prevailing trend.
As a result, the reward to risk ratio of your trade may be decreased as well. Hence, it would be much better that you try to identify a potential reversal area during a pullback and place your trades using more efficient price action based market entry methods.
Identify Potential Pullback Reversal Area
One of the central tenets of technical analysis is the fact that old resistance turns into new support and old support turns into new resistance. By using this principle, you can quickly identify where the market may reverse during a pullback.
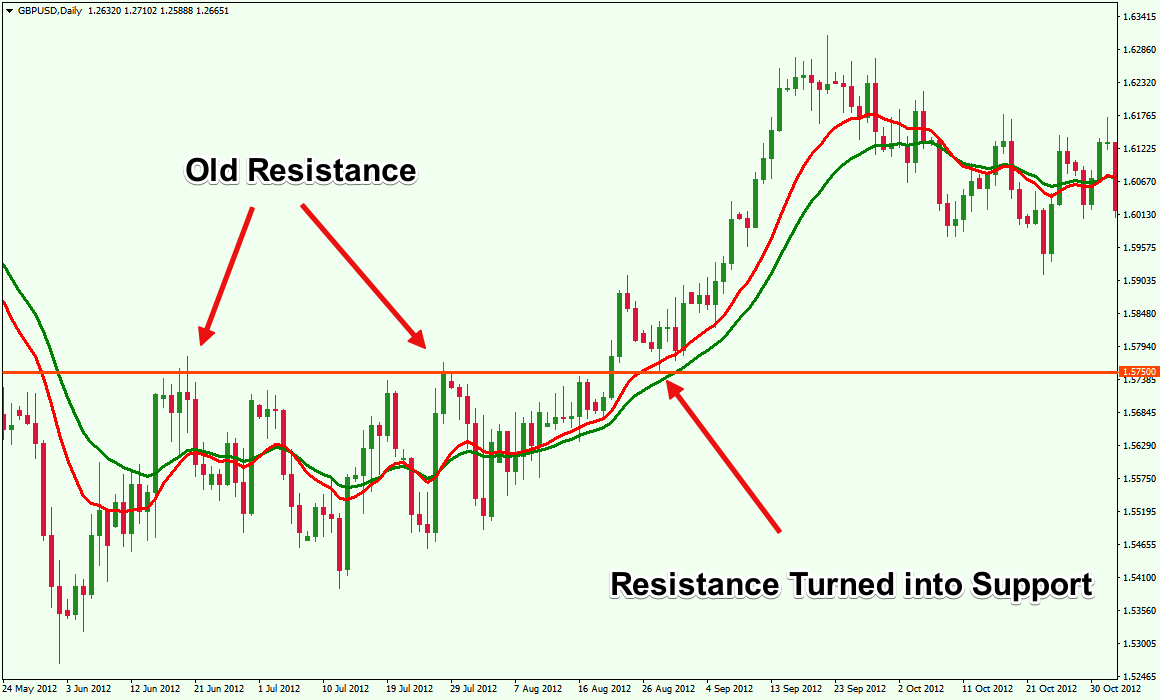
Figure 3: Old Support and Resistance Zones Are Often Potential Reversal Areas During Pullbacks
In figure 3, you can see that the GBPUSD found strong resistance near the 1.5750 level twice. Once the price broke above this resistance level, the first pullback found strong support around this level.
Often you would find that when you are trading pullbacks in a trend, these old support and resistance levels provide an excellent location to place your limit orders on the side of the prevailing trend.
In this instance, if you had placed a buy limit order a few pips above the old resistance, you would have aligned yourself in the direction of the breakout with an excellent reward to risk ratio, as the pullback did not penetrate below the pivot line.
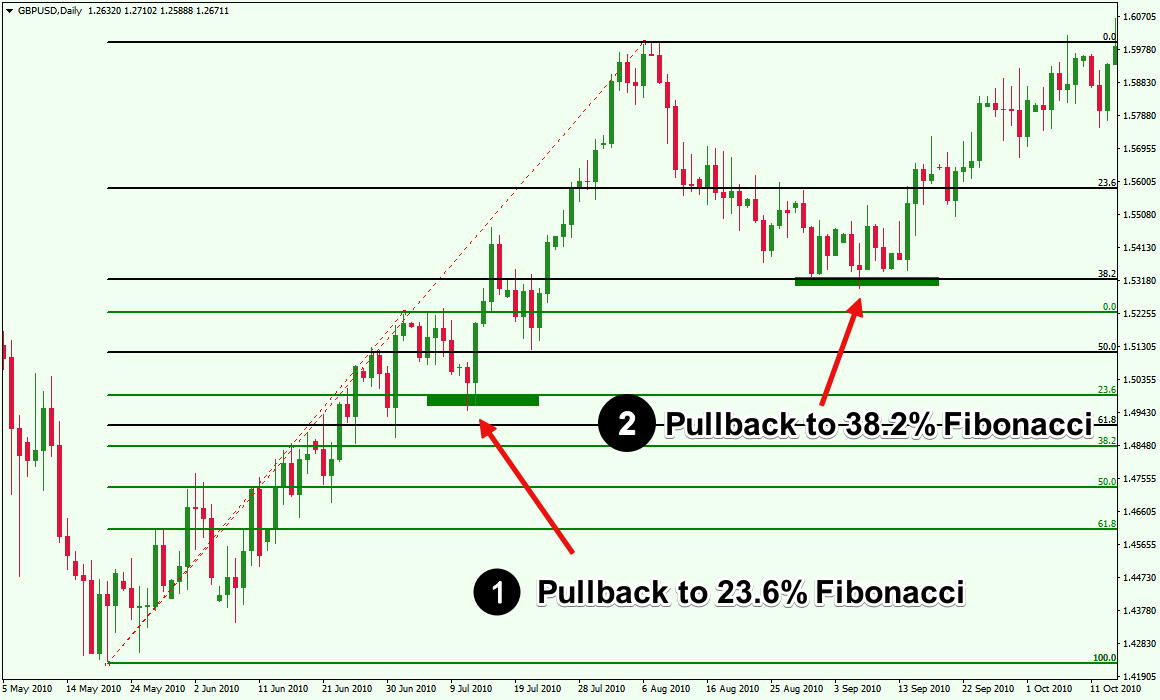
Figure 4: Fibonacci Retracement Levels Can Act as Potential Pullback Reversal Zones
Besides identifying an old support or resistance level for possible pullback reversal points, you can use another time-tested method. In this case I am referring to utilizing major Fibonacci retracement levels. In figure 4, we have drawn two Fibonacci retracement levels on the same uptrend at different swing points using two colors. The Green colored Fibonacci retracement levels identify the first swing point and Black colored Fibonacci retracement levels identify the second major swing point.
As you can see in figure 4, after the first upward swing, the price had a pullback to the 23.6% Fibonacci level, then resumed the uptrend. Once the second upward swing was completed, the price had a pullback to the 38.2% Fibonacci retracement level, then resumed the uptrend. If you apply the Fibonacci retracement tool after the price makes a new high during an uptrend or a new low during a downtrend, you would often find that the price of the asset is respecting these retracement levels. Major Fib levels act as hidden support and resistance zones in the market. In addition, when you have a confluence signal from both a horizontal Support / Resistance area and a Fibonacci retracement level, then this will act to provide for a very high probability trade setup.
Strategies for Entering the Market after a Pullback
For demonstration purposes, we have discussed two basic strategies to get into the market during pullbacks. However, regarding the moving average technique, you would be better off using it to to identify the trend only.
Then you can identify past support and resistance levels on the chart to get an idea of where the pullback may end. Once you have learned to successfully identify a trend, a pullback, and a potential area where the pullback might end, then you can move on to apply a strategy to confirm that the pullback has ended. The confirmation would be your trigger or signal to enter the market.
When you are swing trading pullbacks, one of the best strategies to enter the market is using price action bars. A simple pin bar or outside bar formation near previous support or resistance, or near a moving average, can act as a confirmation that the pullback is ending and the trend is about to resume.
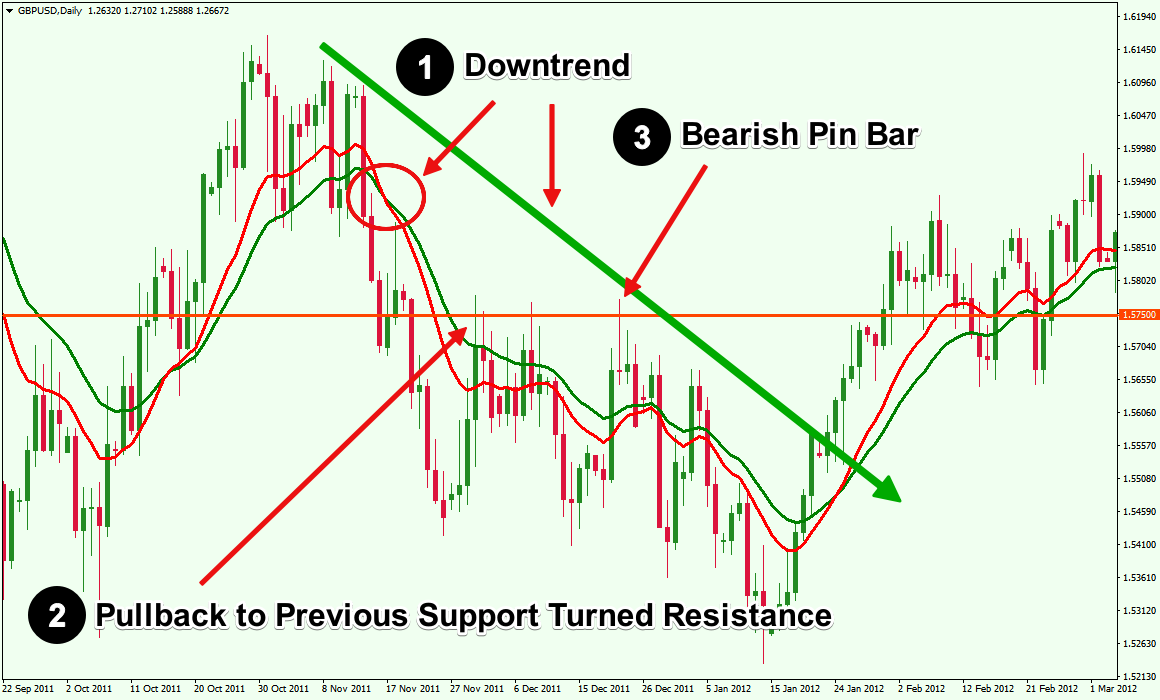
Figure 5: A Bearish Pin Bar Can Act as a Confirmation That the Pullback Has Ended
In figure 5, you can see that the moving average crossover and the downward sloping trend line confirmed that there is a downtrend in the market. Once the downtrend was confirmed, you could identify that the 1.5750 level was acting as a significant resistance as the GBPUSD price got rejected around this level a few times. However, instead of blindly entering the market near this pivot zone, if you waited for the bearish pin bar to appear, which confirmed that the pullback has ended, and entered the market when the price penetrated below the low of the pin bar, the trade would have yielded some nice profits with minimum risks.
You see, when you trade pullbacks by combining multiple factors, you are leveraging the power of confluence and effectively increasing the odds of winning. By using a confluence of an existing trend, support and resistance, and price action bars, you are reducing your risk, while taking high reward to risk trades.
Conclusion
When you are trading pullbacks using a confluence of several technical factors, you are setting yourself up to trade very high-probability setups. However, having a clearly defined trading strategy that outlines under what circumstances you would enter the market is also essential. You would wait for confirmation after identifying a trend and a potential reversal zone, instead of entering the market randomly or haphazardly. You are playing the waiting game, where you are in complete control of the trade, including where to get into the market, where to place your stop loss, and where you may exit the trade.
Trading pullbacks requires patience and a healthy respect for risk. Taking a detailed approach will help you develop discipline in your overall trading. A beginner Forex should model how professional traders execute patiently to try to increase their win rate as well as gain a favorable reward to risk ratio on each trade. Regardless of whether pullback trading meets your trading style or not, you must learn to trade any method you are comfortable with using a predefined set of rules that you will follow thru with conviction.