 Gross Domestic Product (GDP) is a well-known metric of economics and often mentioned in the news or on financial market programs. It is also one of the single most important parameters when creating a fundamental analysis of a currency pair. We are going to take a look at trading GDP in Forex. This article will break down what GDP is, how it is used in currency analysis and the effect the difference between two countries’ GDP has on its exchange rates.
What is GDP?
Gross Domestic Product is the total economic activity generated by private and public companies during a specific period. Economic activity is further broken down into Consumption – which are things like personal spending, clothes, cars, fuel or rent; Investments – such as businesses that invest in new plant equipment or private investment in property; Government Spending – which includes spending on infrastructure, defence or employee salaries; the Balance of Trade is also included with Exports added to Gross Domestic Product figures while imports are subtracted.
GDP economic reports typically cover quarterly and annual periods; this data is revised periodically until the final annual GDP is released. GDP reports are usually released monthly in most countries, although some only release data on a quarterly basis. Releasing this data monthly allows for more frequent updates as to the state of an economy. The US GDP report is released by the Bureau of Economic analysis towards the end of every month. An update is also released on the previous month’s data for quarterly activity. Yearly data is also released monthly and is updated for the previous month.
There are different types of GDP indicators, such as GDP Pro Capita or GDP Constant Prices. What forex market traders watch the most is GDP Growth which is reported on a percentage change basis. This GDP indicator is the most convenient in terms of comparing the state of the two currencies’ economies. In contrast, comparing in dollar terms or per capita would prove especially complicated as many other considerations would have to be made. Therefore, it makes for a more efficient analysis to compare economic activity as a percentage change over a standardized period.
Analyzing GDP Data
Gross Domestic Product economic reports (also called releases, figures or numbers) are such an important and all-inclusive measure of economic activity, that it is an integral component of fundamental analysis for a currency pair.
It goes without saying that a fundamental trader uses GDP data as a key measure in determining the strength of a country’s economy and therefore the strength of its currency.
The use of GDP in forex involves comparing the two sets of data for both currencies and comparing each set of GDP data to its previous releases. The first evaluation involves comparing the GDP data for currency A to the GDP data for currency B.
This comparison helps determine which of the two currencies is enjoying a stronger economy. The next evaluation is between current data and the previous month’s data. This data collection shows the progression of the expansion or contraction of economic activity. A comparison is also necessary to the previous year’s data, and so an evaluation must be made as to whether current data is in-line with previous years for the same period.
GDP data also needs to be set into a context as each country is at a certain level of development and has a certain level of expectation when considering GDP Growth, it is necessary to compare like for like economies on the same basis. An advanced economy may not be expected to achieve annual growth rates above 4%.
For these more developed countries a 3% growth rate is considered relatively high. Whereas, when we look at developing economies, we can expect to see annual growth rates that exceed that number and often double it. For emerging economies, especially those denominated as BRICs (Brazil, Russia, India, and China) annual growth rates not only double those of more developed economies, they often reach double digits.
Looking at GDP growth rates for economies at similar stages of development comes as straight forward. If you are trading EURUSD, when comparing growth rates for both currencies, you can simply look at the two rates, and subtract one from the other, to determine which is expanding at a faster pace. When both economies are well developed, then a 0.5% increase in GDP growth for example, in one currency can be considered in the same light as a similar increase in the other currency’s growth.
This like for like comparison does not transfer when we are looking at currency pairs where one currency is an emerging market currency. The average annual GDP Growth from 2007 to 2017 for the US has been below 2%, with expansionary phases showing growth reaching peaks at 2.5%. Looking at China, growth in expansionary phases has reached over 8% and until 2012 often reached double figures.
A 0.5% rise in GDP Growth for China when looking at USDCNH cannot be considered in the same way as a 0.5% increase in the Euro area when looking at EURUSD. A 0.5% increase in annual GDP Growth for the Euro area would be a significant event; consider that the average annual GDP growth rate for the Euro area from 1995 to 2017 was a mere 0.4%, while China has averaged 9.7% for the same period. When considering GDP growth rates between two currencies, it is necessary to also consider the overall state of each currencies’ economy and the historical average growth rate.
The Effect of GDP Data on a Target Currency
GDP data is one of the most closely watched economic indicators because it defines the expansion or contraction of an economy in a fairly straightforward manner. Data is easy to track over extended periods of time, and the various stages of the economic cycle can be established. For example, in the case of a recession, which is defined as a period with two or more consecutive quarters of negative growth.
With this in mind, GDP growth rates are a large driving factor in a currency’s performance due to the effects economic activity has on a currency. Higher levels of economic activity will create a greater demand for the currency in question; companies and individuals will need larger amounts of currency driving up demand. Increases in economic activity also create an increase in the total value of the economy, as all currencies are fiat money, and the more value an economy has, the more value the currency will also have.
Secondly, this demand will create the need for monetary tightening to prevent the economy from over-heating. Monetary tightening means that interest rates for assets, for example, government bonds denominated in the target currency will also be higher.
Higher returns for these assets will drive investor interest, and therefore that currency will appreciate near term, as money flows into the currency to buy these assets.
Increases in GDP Growth rates of the Base currency that are sustained and higher than the growth rate in the Quoted currency will usually see the Base currency appreciate in value. What traders are looking at is the differential between the two currencies’ growth rates; the one that has a higher growth rate will usually experience an appreciation in its currency.
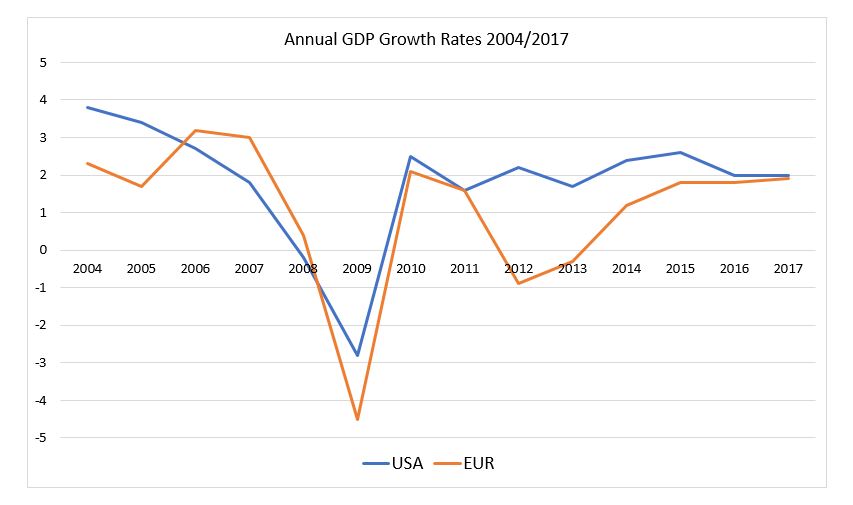
The chart above shows how annual GDP Growth in the Euro area outpaced that of the US from 2006 to 2008 when both economies fell into a recession due to the financial crisis. From 2009 to 2014 the US annual GDP Growth rate outperformed that of the Euro Zone.
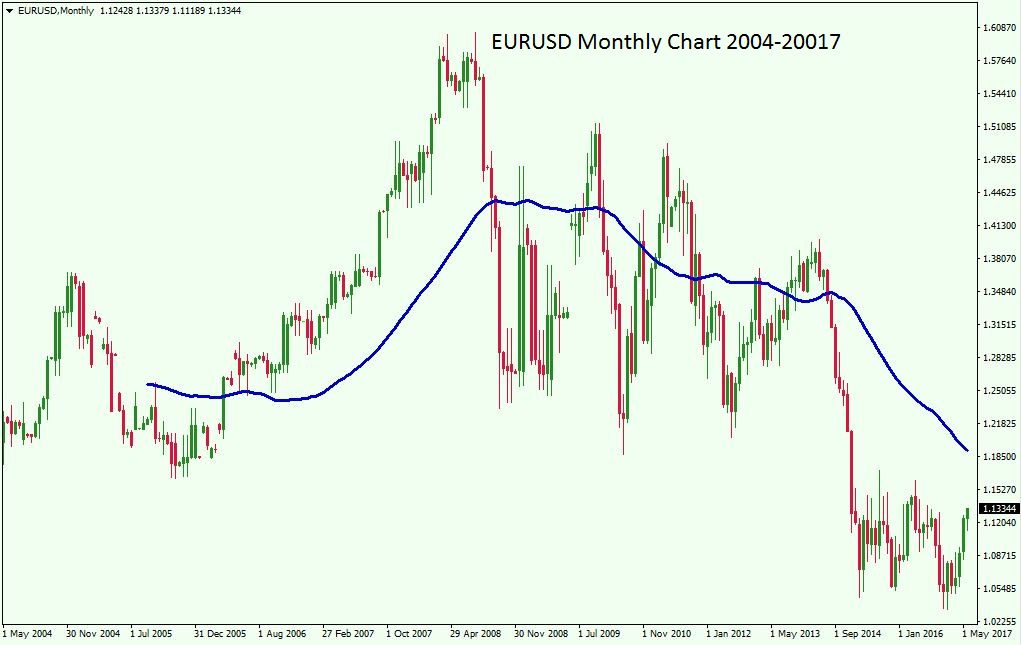
Looking at the price chart below, we can see that the Euro continued to appreciate as the US dollar weakened for the 2006-2008 period. The EURUSD rises from levels around 1.1700 to hit its all-time high in July 2008 at 1.6038. Referring to the chart above we can see how, throughout that period, GDP growth in the Euro area had been consistently higher than in the US.
After the effects of the financial crisis had been contained, economic growth started expanding at a faster pace in the US than the Euro area. The EURUSD saw a slowly downward sloping price movement, with price reaching a low of 1.1875 by June 2010.
Price movements in FX are also based on expectations and not just on most recent data. After the economic crisis of 2008, the varying expectations for economic growth continued to have a certain impact on the Euro’s price. However, it was also subject to geopolitical and financial crises within the Euro area. The Greek debt crises of 2010/2011 and the Italian, Spanish, Irish and Portuguese (PIIGS) banking crisis of 2011/2012 created an extremely volatile market for the Euro.
Trading Gross Domestic Product Releases
Trading GDP numbers can be a bit tricky. The FX markets price-in expected data and events while data releases are not always in-line with expectations. This means, that if a certain country is expected to have a high GDP reading and that event materializes, then the market reaction will usually be subdued. There is usually little to no reaction due to the data release being uneventful as expectations were simply met. In fact, while you would expect a currency to appreciate against its peers in the case of strong GDP Growth, you may actually see it decline.
This happens as markets often over anticipate big news releases, so an increase in GDP Growth which was as expected may not be enough to propel the price of the currency higher. Due to markets over-pricing events and data, once the GDP figure is released it may even cause depreciation in the price of the currency, despite showing GDP increasing. GDP Growth figures are certainly very important, but FX markets are more likely to cause an over-reaction in price before the next GDP release, giving way to adverse price movements.
Another scenario is that the GDP figure released is greatly lower or higher than expected. This would most likely create volatility as traders and investors react to this unexpected number. A much higher than expected GDP Growth rate will typically cause the target currency to appreciate, at least immediately. The continued trend following the initial rally in the currency will depend greatly on the overall state of the currency’s economy.
Let’s say the economy is struggling to show growth, and there may have already been several months of low GDP data, and unexpectedly there is a jump higher in the latest GDP release.
The immediate market reaction, ranging in time from a few minutes to a few hours, will be that of buying the target currency. Traders will feel that the currency had perhaps been oversold given the new data and is currently undervalued. Trader’s will begin buying the target currency in the hope of seeing it reach higher prices, at least for the short term.
But it shouldn’t come as a surprise if, after the initial rally, this currency sees its price increase fade and eventually turn back to levels quoted before the GDP data release. One GDP data release, although important, would not be enough to change the overall fundamental picture of the currency’s economy.
GDP data releases usually come as quarterly data and annual data. These releases are made for most countries on a monthly basis. The most important number to watch, and the one that will be more likely to drive volatility, is the quarterly GDP Growth. Quarterly data are more subject to differences from economists’ forecasts. Analysts and economists publish their expectations which are therefore well known and deviations from these expectations can often drive the markets in a particular direction.
When is an Economy Expanding?
This differs from country to country and depends on the level of development of the country’s economy. It also depends on other factors that create a more or less active economic environment. We’ll take a look at the three largest economic areas – the US, Euro Zone, and China.
In the US, since that 2008 financial crisis a healthy expanding economy has been considered as having annual GDP Growth of 2% or higher, while lower readings still show economic growth, it is not considered as being at full or close to full capacity.
The Euro area is considered as historically having a GDP Growth rate somewhat lower than that of the USA. This has usually been the case over the past two decades. From 1995 to 2017 the average annual US GDP Growth rate has been 2.4%, while, over the same period, in the Euro area the average has been 1.6%. Having said that, for the Euro area the consensus for a healthy expanding economy is at 2% or higher.
China has had very high GDP Growth rates over the past 40 years. From 1978, the year China started its economic reforms, the country has averaged annual GDP Growth rates of 9.6%. Since the 2008 crisis, the economy has only been able to run at double-digit growth between 2010 and 2011.
The country has been critical of its growth rate having slowed to levels below 7%. Analysts vary on the level to attribute to healthy expansion in China, however, most place it between 7% and 9%.
Understanding Economic Cycles
Understanding a country’s economic cycle within the fundamental analysis framework, helps an analyst to gauge potential exchange rate movements. As we have seen, a jump in the annual GDP Growth rate for China of 0.5%, although positive news for the currency, would not have the same impact as an equivalent rise in the US annual GDP Growth.
Simply put a 0.5% increase in GDP Growth in an economy that is currently at say 2% represents and an increase in economic activity of 25%, while the same increase in an economy experiencing 7% growth represents approximately a 7% increase in economic activity.
Another factor to consider is where the currency is in its economic cycle. Let’s say that the US is already at 2.5% GDP Growth, and the current data release shows growth at 2.7%. The new data shows an increase in GDP, but it may also give analysts and economists doubts as to how long that level might be sustainable. FX markets always price-in future events and data, so you have to consider if the economy has reached the peak of its economic cycle.
Wrapping up
As mentioned, fundamental analysis of a currency should include GDP data. Back data and its ease of access on various websites such as the World Bank or St. Louis Fed allow for a complete understanding of the economic situation for a given currency. Expectations of economic data releases including GDP data can be found on various financial sites and are often published in real time. It’s important to remember that positive data matching expectations may not necessarily be bullish for a currency, and may even lead to its depreciation. Keep in mind that not all jumps in growth can be valued the same way, as a lot depends on the average growth rate and target currency.