Channels are an important component of technical analysis. There are quite a few types of channel trading techniques that can be applied. Some of these include Fibonacci Channel, Andrews Pitchfork, and the Keltner Channel. In today’s lesson, we will discuss another important type of trading channel known as the Linear Regression Channel. We will discuss the structure of the Linear Regression channel and some best practices for applying it to your price charts to improve your analysis.
What is a Linear Regression Channel
The Linear Regression Channel is a three-line technical indicator, which outlines the high, the low, and the middle of a trend or price move being analyzed. The indicator was developed by Gilbert Raff, and is often referred to as the Raff Regression Channel. The Linear Regression indicator is typically used to analyze the upper and lower limits of an existing trend. It helps traders to find optimal entry and exit points during price tendencies on the chart.
Structure of the Linear Regression Channel Indicator
The Linear Regression Channel indicator consists of three parallel lines – the upper line, lower line and the median line.
Upper Linear Regression Line
The upper Linear Regression Channel line marks the tops of a trend. It is built by going through the most projecting top on the chart. The lower and median line will be parallel to this upper line.
Lower Linear Regression Line
The lower Linear Regression Channel line marks the bottoms of a trend. It is built by going through the most projecting bottom on the chart. The upper and median line will be parallel to this lower line.
Median Linear Regression Line
The median line is the base of the Linear Regression Channel indicator. It draws the midpoint of the trend. The upper and lower lines are evenly distanced from this middle line.
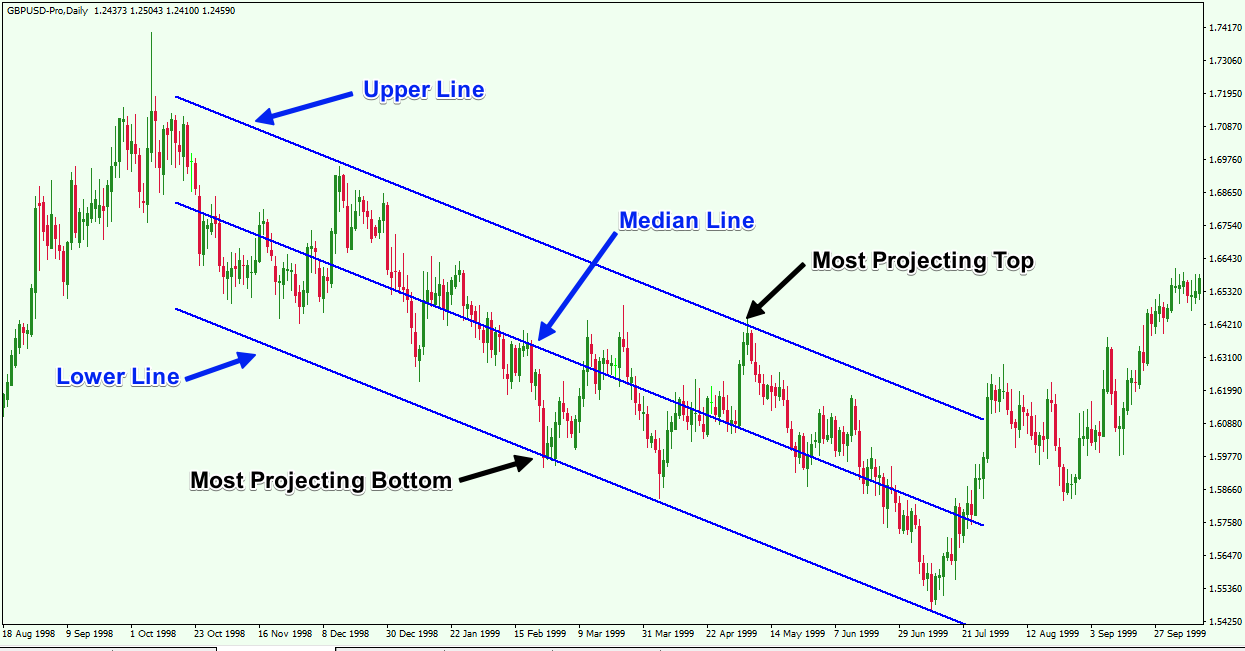
Above you can see the Linear Regression Channel indicator and its components. The black arrows show the most projecting top and bottom in the trend. The three blue lines point out the upper, lower, and median line of the indicator.
Using Linear Regression on a Price Chart
The Linear Regression Channel can be used to time your entries and exits more effectively. Each time you see a price interaction with the upper or lower line of the drawn indicator, you should become aware that the price action may be due for a change in direction. Also, when the median line gets broken in the direction of the trend, this means that a current impulse wave is likely forming, which could provide for a trend continuation signal.
Another important signal that comes from regression trend analysis is the eventual break out from the channel. When the price breaks the Linear Regression channel in the direction opposite to the prevailing trend, this gives a strong signal that the regression channel break will create a significant turning point in the price action.
Types of Linear Regression Channels
There are two types of Linear Regression channels, depending on the direction of the trend – the bullish and the bearish linear Regression channels. These two types of regression channels are defined based on the Linear Regression slope.
Bullish Linear Regression Channel
The bullish Linear Regression Channel refers to bullish trends. In this case, the price is increasing and the slope of the Linear Regression is upwards.
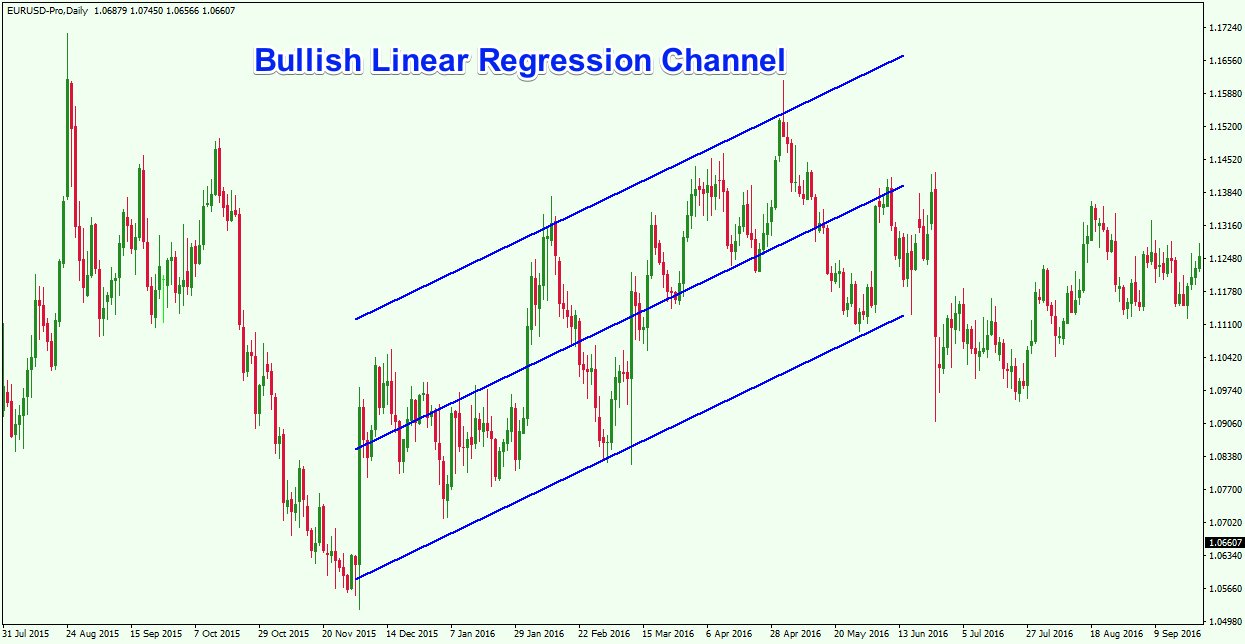
Above you see a bullish Linear Regression Channel. The trend is bullish and the indicator is upward sloping.
Bearish Linear Regression Channel
The bearish Linear Regression Channel is opposite to the bullish Linear Regression and it refers to bearish trends. For the bearish scenario, the price is decreasing and the slope of the Linear Regression is downwards.
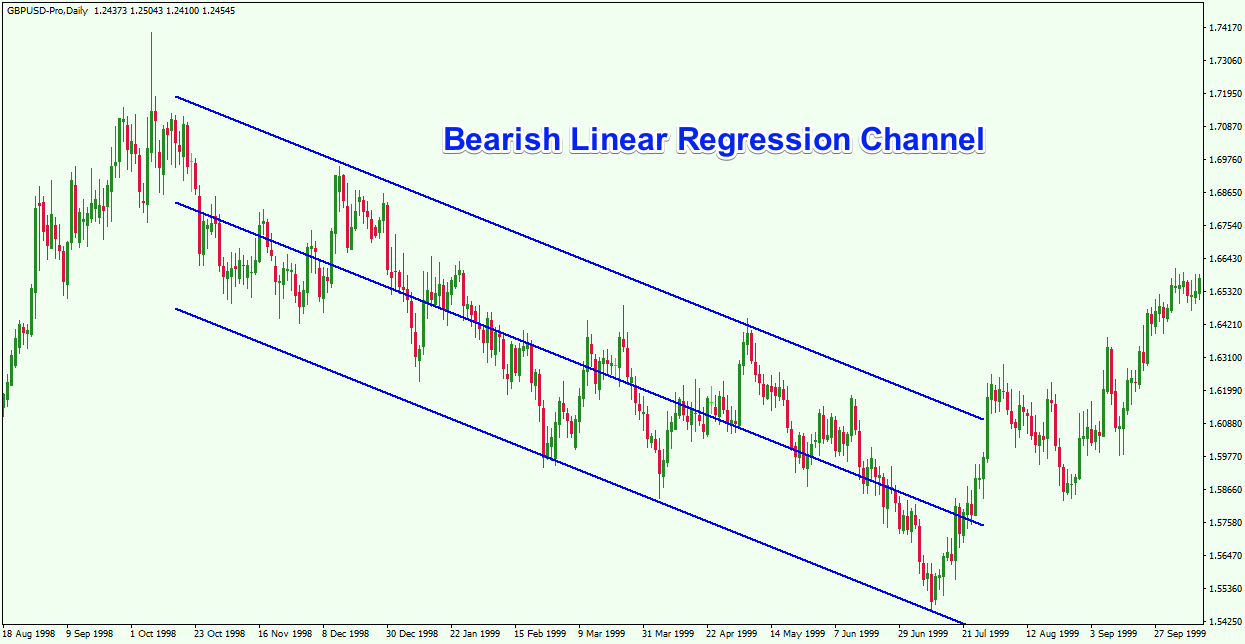
This is the bearish Linear Regression indicator. The trend is bearish which means that the slope of the linear regression line is downward sloping.
MT4 Regression Channel Indicator
As with any type of technical study that you use, it is useful to know the basics of how an indicator or study is calculated.
But in any case, you will find the Regression Channel indicator built into most Forex trading platforms including MetaTrader 4. We will now take a look at how to add this indicator to your MT4 platform and how to build a price chart using this channeling technique.
Adding the Linear Regression Indicator
First, you need to select the indicator from the menu of the MT4 platform. You can do this by going to the top of the MT4 window, then clicking on Insert > Channels > Linear Regression. Now you have selected the indicator and it is activated as a drawing tool for your mouse cursor.
Drawing the Linear Regression Channel
Now you need to actually draw the Linear Regression Channel. Simply select the beginning of a trend and stretch the indicator to another crucial point of the trend. The three lines of the indicators will self-adjust depending on the most projective top and bottom of the trend. Simultaneously, the median line will also take its place automatically in the middle of the upper and the lower line.
Linear Regression Channel Analysis
The primary form of Linear Regression Channel analysis involves watching for price interactions with the three lines that compose the regression indicator. Each time that the price interacts with the upper or the lower line, we should expect to see a potential turning point on the chart. For swing traders, this means that you want to enter after a retracement in the direction of the trend, and exit when price approaches the opposite end of the channel.
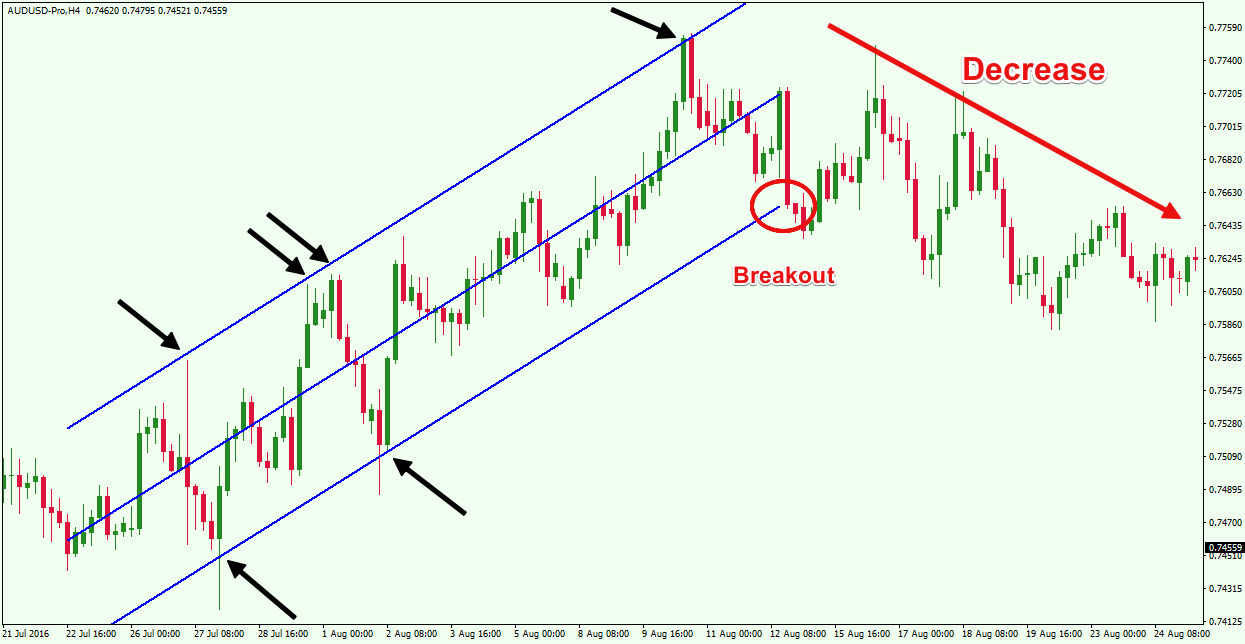
The chart above illustrates a bullish Linear Regression Channel. The black arrows point to channel extremes where the price action is well contained by the indicator.
The second bottom on the lower line of the indicator should be used to enter a long trade. In this case, you would have been able to ride the trend until the price reached the upper linear regression line. This is shown by the top arrow.
The price reverses afterwards as it breaks the lower line. This creates a breakout opportunity on the chart, meaning that the trend is now likely to reverse. We did see price move back up again to test the previous top but failed to take it out. At the same time, we see a Pin Bar formation, followed by a second breakout below the Regression line.
Depending on where you had placed your stop loss, your first breakout trade may or may not have been profitable, however, on the second breakout, if you had placed a sell order below the breakout point and a stop loss above the Pin Bar high, it should have resulted in a profitable trade.
Forex Linear Regression Trading System
Now let’s discuss how you can create a rule based Forex Linear Regression trading system, which will help you to plan out and execute your trades more effectively.
Entering a Linear Regression Trade
Let’s take the case for a bullish price trend, which would have an upward sloping channel.
To enter a Linear Regression trade, you should buy the Forex pair on the second bounce off the lower line of the indicator. The second bottom is used to confirm the presence of the trend. Since the bottoms are increasing, a trend is probably emerging on the chart. Therefore, we would look to buy the currency pair at this time, attempting to catch an upcoming bullish impulse.
Opening a bearish Linear Regression trade works the same way, but in reverse fashion.
Stop Loss on a Linear Regression Trade
You should always use a stop loss order when trading a Linear Regression based strategy. If you are trading a bullish Linear Regression setup, the stop loss order should be placed below the swing low created by the price bounce from the lower line of the indicator.
Conversely, if you are trading a bearish Linear Regression, your stop loss order should be placed above the swing high created by the price bounce from the upper line of the indicator.
Linear Regression Take Profit Rules
You have two options to take profit using the Linear Regression study. The first option is to hold your trade until the price action reaches the opposite Linear Regression level, which we discussed in an earlier example.
You can apply another take profit approach for your Linear Regression trade as well. This would be to hold the trade until the price action breaks the median line in the opposite direction of the prevailing trend. This means that if you trade long, you could hold the trade until the price extends above the median line, and breaks it downwards. If you are shorting, then you could close the trade when the price goes below the median line and then breaks it upwards.
Of course, none of the Linear Regression trades should be held if the price action breaks the channel in the direction opposite to the general tendency. If a breakout in the Linear Regression Channel occurs, then you should close the trade, and possibly look to position counter trend.
Bullish Linear Regression Channel Trading Example
Let’s now take a look at a few examples on the chart based on our stated linear regression rules. We will start with a bullish Linear Regression chart example shown below.
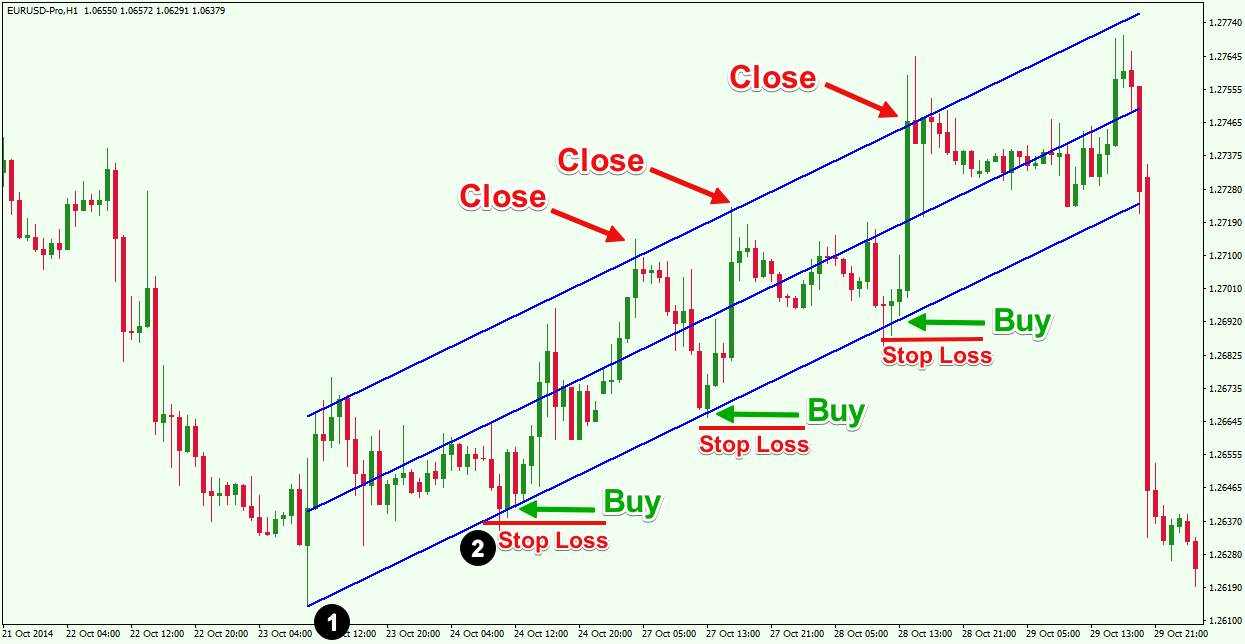
This is the hourly chart of the EUR/USD Forex pair for Oct 21-29, 2014. The image shows a bullish Linear Regression Channel.
Take a look at the two numbered points on the chart. We use these two bottoms to build the indicator. When the price bounces a second time, we identify the second bottom, we build the indicator and look to open a long trade. Then we should place a stop loss order right below the new low.
The price increases through the median line, creates a swing in the median area and then expands to the upper level of the indicator. This is when we should look close your trade.
The second trade comes when the price action reaches the lower level of the Regression Channel. The bullish candle which closes after the interaction with the lower level marks the bounce from the line. Therefore, you look to buy again placing a stop loss order below the created bottom.
As you can see, the price action increases rapidly and reaches the upper level of the Linear Regression indicator. You would look to close the trade when the price approaches the upper line.
The price returns to the lower line of the indicator afterwards. Then we see another bounce from the lower level. We repeat the process for a third time. We buy the EURUSD pair and we place a stop loss order below the created bottom. Then we hold until the price reaches the upper level of the indicator.
The next time the price returns to the lower level it creates a breakout opportunity which accounts for a significant decrease in price.
Bearish Linear Regression Channel Trading Example
Now let’s shift our attention to a Bearish Linear Regression Channel trading example. However, this time we will take the alternative take profit approach where we hold the trade until the price action breaks the median line from the side which is opposite to the trend.
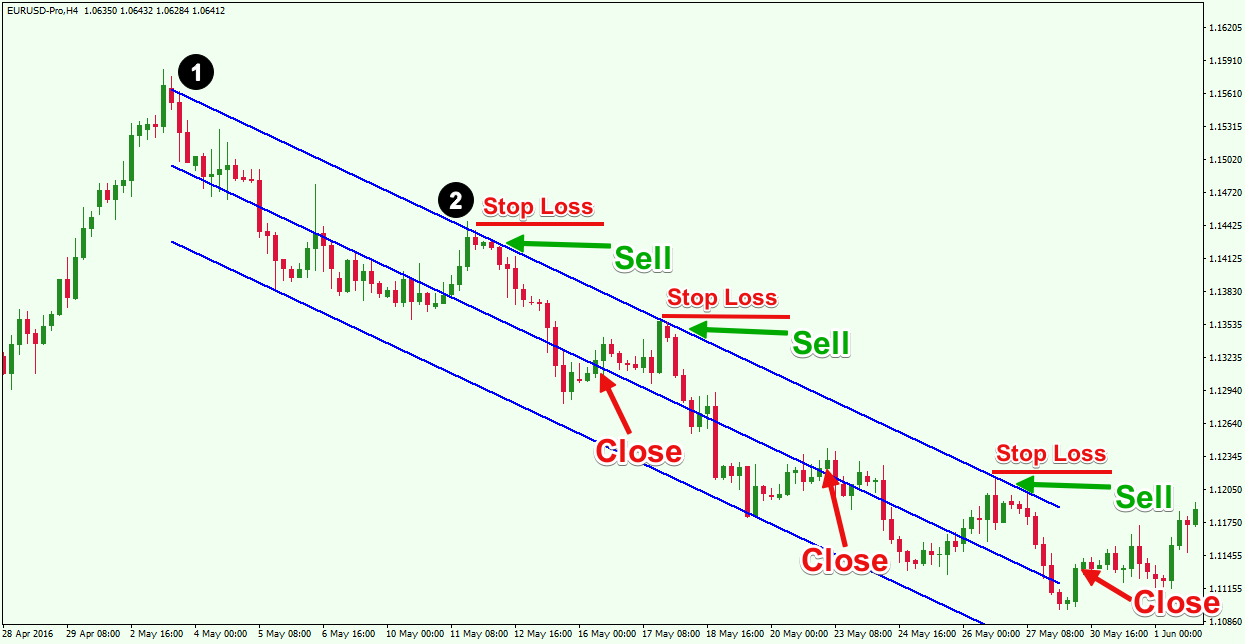
The image above is the 4 hour chart of the EUR/USD for May-June, 2016. This time we approach a bearish Linear Regression trading example.
Take note of the two numbered points that mark the two bases of the Regression channel. When the price bounces a second time, you could build the indicator and look to short the EUR/USD Forex pair. Then you need to secure your trade with a stop loss order above the created top. This is shown with the red horizontal line.
Notice how the price decreases afterwards and moves below the median line. For this trade management exit, we would look to close the trade when the price breaks the median line in the bullish direction from below.
Soon afterwards, the price returns back to the upper level of the bearish Linear Regression channel. When you see the new bearish bounce from the line, you should look to short the EUR/USD pair again, placing a stop loss order above the created top.
The price quickly moves below the median line and touches the lower level. Our exit strategy states that we need to see the price switch back above the median line in order to close the trade. Therefore, we hold until this happens.
The third return to the upper line leads to another bearish bounce, which is another short signal on the chart. Again, you would look to sell the EUR/USD placing a stop loss as shown on the image.
In this case, the price action declines below the median line in just a few periods. As you can see, the price breaks the median line upwards and soon after breaches the upper level of the bearish Linear Regression Channel as well.
In the first two short trades, we would have generated more profit if we have waited until the opposite level was reached. However, in the third trade, where the price did not reach the opposite level and a complete reversal occurred on the chart, the median line exit proved to be better. In this third case the median line saved us from a losing trade.
The trade exit strategy that you employ with a linear regression channel will be based on your own preference and comfort level. Unfortunately, there is no best solution for every case.
Conclusion
- The Linear Regression Channel a.k.a. Raff Regression Channel is a three line channel indicator developed by Gilbert Raff.
- This indicator provides a framework for identifying and trading within a trend.
- Using the Linear Regression Channel indicator helps traders better time their entries and exits.
- The Linear Regression Channel consists of three lines, which are evenly distanced and parallel:
- Upper Line – marks the upper boundary of a trend
- Lower Line – marks the lower boundary of a trend
- Median Line – marks the midpoint of the trend
- There are two types of Linear Regression Channels depending on the trend direction and respective slope of the indicator:
- Bullish Linear Regression Channel – plotted during bullish trends and is upward sloping.
- Bearish Linear Regression Channel – plotted during bearish trends and is downward sloping.
- The Linear Regression Channel is built in the MetaTrader4 platform. To add the indicator to your chart you should perform the following steps:
- Go to the top menu of the MT4 platform and click on Insert > Channels > Linear Regression
- Then select the beginning of a trend and stretch the indicator along the tendency.
- Linear Regression Trading Strategy (bullish):
- Enter a trade when the price bounces from the lower level of the Regression Channel.
- Put a stop loss order below the bottom created prior to the bounce.
- You would hold the trade until one of the following conditions is met:
- The price reaches the Upper Linear Regression level.
- The price switches above the median line and then breaks it downwards.
- The price completely breaks the Linear Regression Channel in the direction opposite to the trend.
- Apply the strategy in the opposite direction for bearish Linear Regression Channel trades.